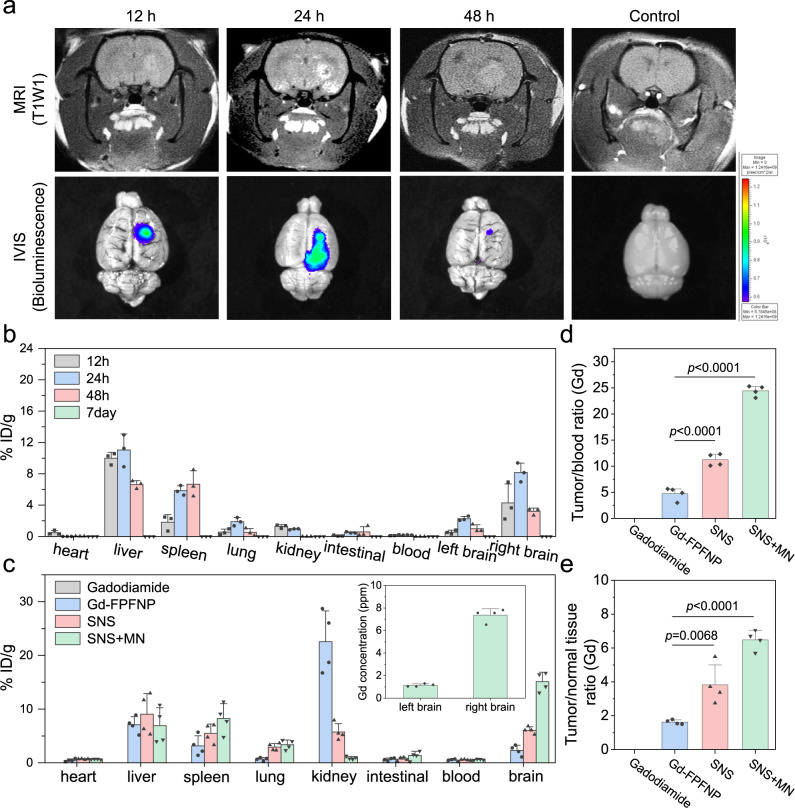
Fig. 4. Tumor accumulation and biodistribution of stem cell–nanoparticle system (SNS) and Gd-Fu@IO@PVA/Fu nanoparticle (Gd-FPFNP).
a Magnetic resonance imaging (MRI) and in vivo imaging system (IVIS) images of the F98 glioblastoma multiforme (GBM) at different times. The study was performed with n = 6 rats. The images for MRI and IVIS are representative of 6 images. b Gd concentration in various organs at post 12 h, 24 h, 48 h, and 7d intracarotid injection of SNS. The Gd content was measured suing inductively coupled plasma mass spectrometry (ICP-MS). The results were expressed as mean ± SD, n = 3 rats. % ID/g: percentage of injected dose per gram of tissue. c Gd concentration in various organs at 24 h post treatment of gadodiamide, Gd-FPFNP, SNS, and SNS plus magnetic navigation (MN). The concentrations for gadodiamide group were all below the detection limit. The results were expressed as mean ± SD, n = 4 rats. d Tumor-to-blood (T/B) ratio and e Tumor-to-normal tissue (T/N) ratio of gadodiamide, Gd-FPFNP, SNS, and SNS plus MN groups at 24 h post treatment. The results were expressed as mean ± SD, n = 4 rats. Statistical analysis in d and e were performed by Graph Pad Prism 9.0 Software: one-way ANOVA with Tukey’s multiple comparisons test. For d, the p values of Gd-FPFNP to SNS and SNS plus MN are both are <0.0001. For e, the p values of Gd-FPFNP to SNS and SNS plus MN are 0.0068 and <0.0001, respectively.

