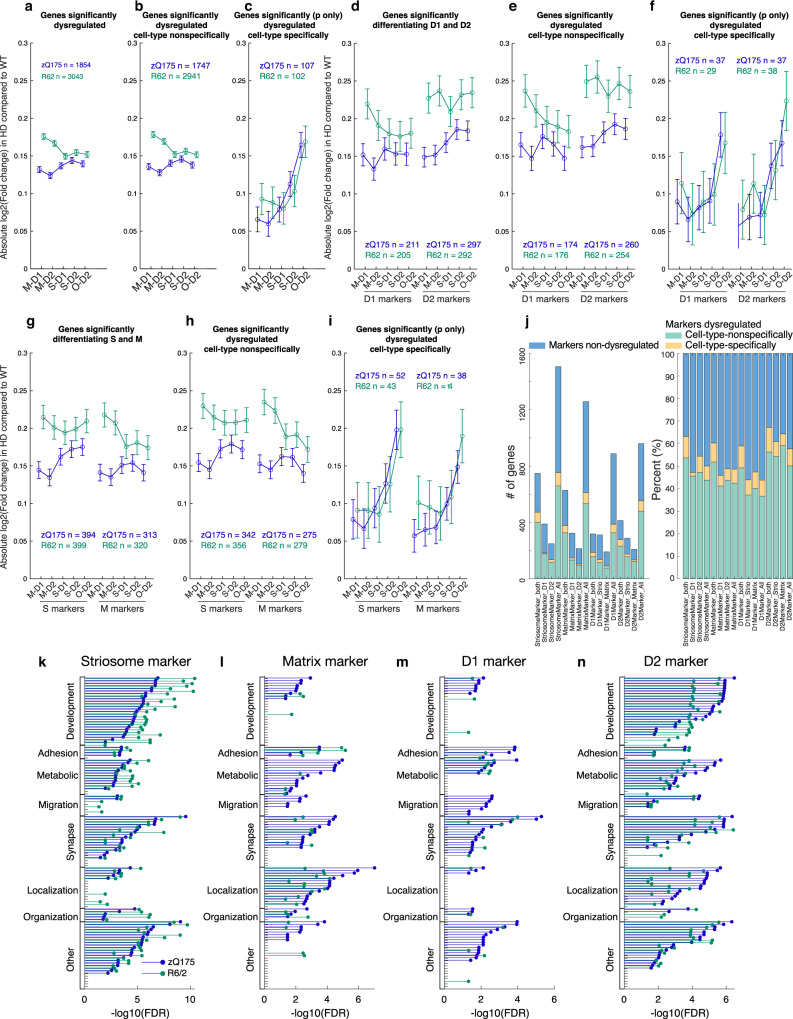
Fig. 5. Cell-type-specific dysregulations reflect the intrinsic vulnerability shared across multiple HD models.
a–c Only cell-type-specific gene dysregulations are shared between the two HD models. Average degrees of dysregulation, i.e., absolute value of log2(fold change of the expression in HD as compared to that in controls), are shown for all dysregulated genes detected with the criteria of abs(log2FC) > 0.1 and p < 0.001 in at least one of four canonical cell types (a), or the subset of them that are unidirectionally dysregulated (i.e., upregulated, or downregulated in all four cell types, b). In c, we first selected genes with significant dysregulation (p < 0.001) in at least one of four canonical cell types, then further restrict to the genes that are dysregulated bidirectionally dependent on the cell types (i.e., upregulated in one cell type(s) and downregulated in another cell type(s)). N indicates number of markers included in each panel. Error bars indicate 95% confidence intervals. One-way ANOVA followed by Tukey-Kramer post-hoc multiple comparison test. d–f, Same as a–c but restricted for D1-D2 markers. g–i, Same as a–c but restricted for S-M markers. j, Composition of patterns of dysregulation for D1-D2 markers and S-M markers. k, FDR for enriched GO terms in dysregulated striosome markers in zQ175 (blue) or R6/2 (green) mice. Within the GO terms overrepresented in dysregulated striosome, dysregulated matrix, dysregulated D1, or dysregulated D2 markers, top (i.e., lowest FDR) 40 GO terms are included, and grouped into 9 categories. In each group, the GO terms are sorted by FDRs for zQ175 mice. l–n, Same as k but showing FDRs of the enrichments in dysregulated matrix (l), dysregulated D1 (m), or dysregulated D2 (n) markers. See also Supplementary Fig. 7.

