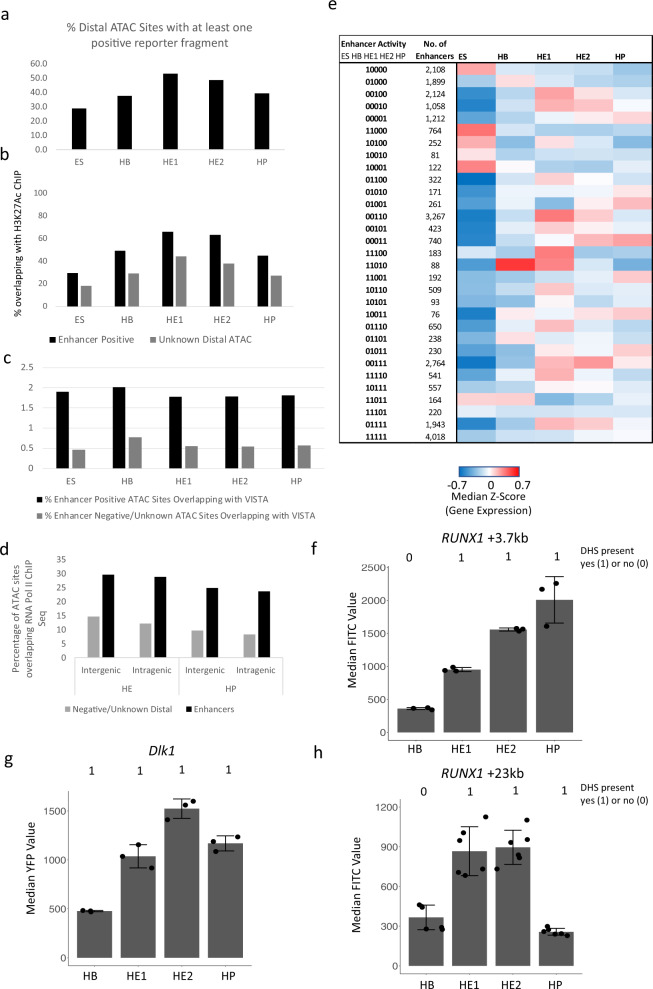
Fig. 2. Characterization of enhancer features and association of cell stage-specific enhancer activity with cell stage-specific gene expression.
a Distal ATAC sites containing at least one fragment scoring positive in our assay. Source data are provided as a Source Data file. b Percentage of functionally identified distal elements scoring positive in our screen overlapping with histone H3 lysine 27 (H3K27Ac) peaks as compared to inactive elements or where activity is not known. ChIP data from ref. 18. Source data are provided as a Source Data file. c Overlap of fragments scoring positive in our assay with known enhancers from the VISTA database26. Source data are provided as a Source Data file. d Percentage intergenic and intragenic fragments scoring positive in our assay overlapping with RNA polymerase II binding sites in the hemogenic endothelium and HP cells. Pol II data from ref. 30. Source data are provided as a Source Data file. e Presence or absence of enhancer activity at the different developmental stages expressed as binary code (0 = scoring negative; 1 = scoring positive) and sorted by the activity pattern across differentiation. The heatmap depicts the activity of the genes associated with these elements. Enhancer - promoter association was determined by using the union of HiC data from ES and HPC7 (HP) cells29 together with co-regulation data determined by ref. 21 in a total of 21,671 elements. All promoters not covered by these data (5599) were associated by being the nearest to the enhancer element. f–h Activity profiles of individual enhancers identified in our screen in single ES cell clones during differentiation. The presence or absence of an ATAC-peak is indicated by the binary code used in (e). f RUNX1 + 3.7 enhancer element (chr16:92822182-92822601). g Dlk1 enhancer element (Chr12: 109437601-109438085), h RUNX1 + 23 kb enhancer element49. Data are presented as mean values + /− standard deviation (SD). Dots showing individual values for Dlk1 and Runx1 + 3.7 kb n = 3 biologically independent experiments and for Runx1 + 23 kb n = 6 biologically independent experiments. For sequence details see Supplementary Notes. Source data are provided as a Source Data file.

