Figure 4.
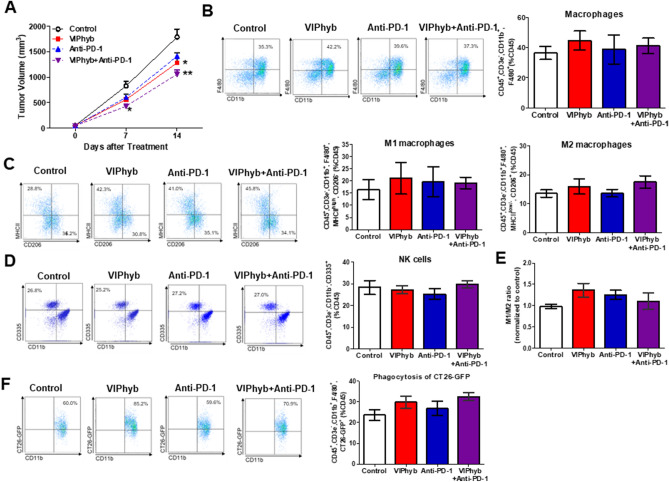
VIP antagonist in combination with anti-PD-1 antibody significantly reduced CT26-tumor growth in immunodeficient SCID mice. Tumor volume during 2-week treatment (A); n = 6–8/group. Representative FACS histograms and flow cytometric analysis of macrophages (B), M1 and M2 macrophages (C), NK cells (D), M1/M2 macrophage ratio (E), and phagocytosis of CT26-GFP (F) of tumor-infiltrating leukocytes isolated from each group. PBS was used as control. Gating strategies for macrophages and NK cells isolated from tumors are shown in Supplemental Fig. S3. The value in representative FACS histograms was shown as %gate. The data in bar graphs were calculated based on %CD45. M1/M2 ratio was calculated by M1 events/M2 events. The value of the M1/M2 ratio of each treatment was then normalized to the value of the M1/M2 ratio of controls that were performed on the same day. n = 4–5/group. Data from each treatment were compared with data from the control; *p < 0.05, **p < 0.01 compared with controls on the same day.

