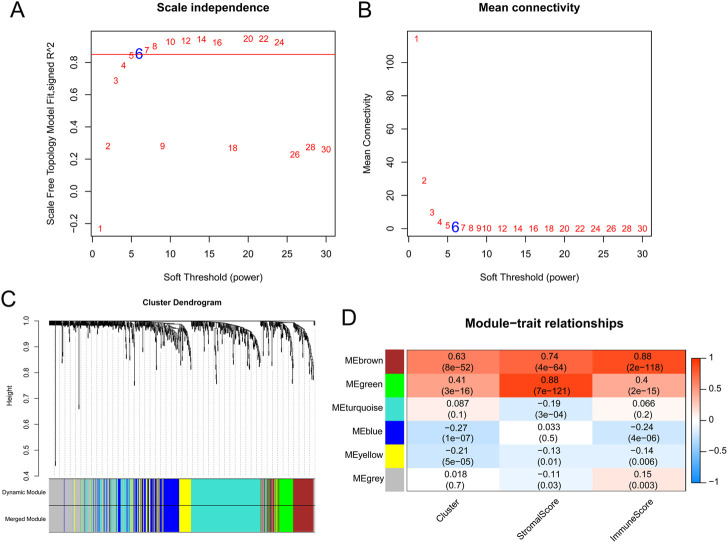
FIGURE 3.
The results of weighted gene co-expression network analysis. (A) Estimation of the scale independence index of the 1–30 soft threshold power (β = 6). (B) Determination of the mean connectivity of the 1–30 soft threshold power. (C) Tree diagram for module division (different color represent different modules). (D) Relationships of the module with the cluster and immune and stromal scores.

