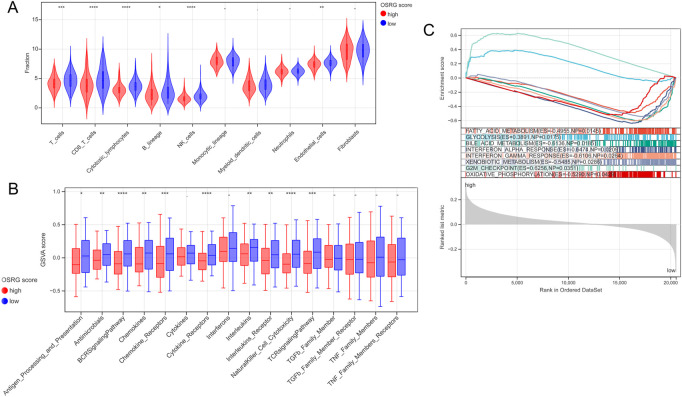
FIGURE 6.
Immune microenvironment and gene set enrichment analysis (GSEA) analysis between the high and low OSRG score groups. (A) Six differential immune cells were obtained between the high and low OSRG score groups. (B) The enrichment score of 16 immune gene sets showed significant differences between the high and low OSRG score groups. (C) Eight HALLMARK gene set enrichment pathways were significantly different between the high- and low-OSRG score groups. *p < 0.05, **p < 0.01, ***p < 0.001, -P > 0.05.

