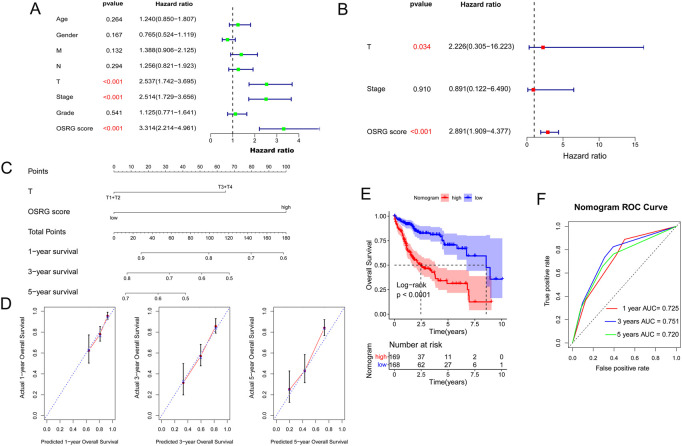
FIGURE 7.
Construction of a nomogram. (A) Univariate analysis of OSRG score and clinicopathological characteristics. (B) Multivariate analysis of OSRG score and clinicopathological characteristics. (C) A nomogram for predicting 1-, 3-, and 5-year OS. (D) Calibration curves for predicting 1-, 3-, and 5-year OS. (E) Kaplan‒Meier analysis of the nomogram. (F) The AUCs for predicting 1-, 3-, and 5-year OS.

