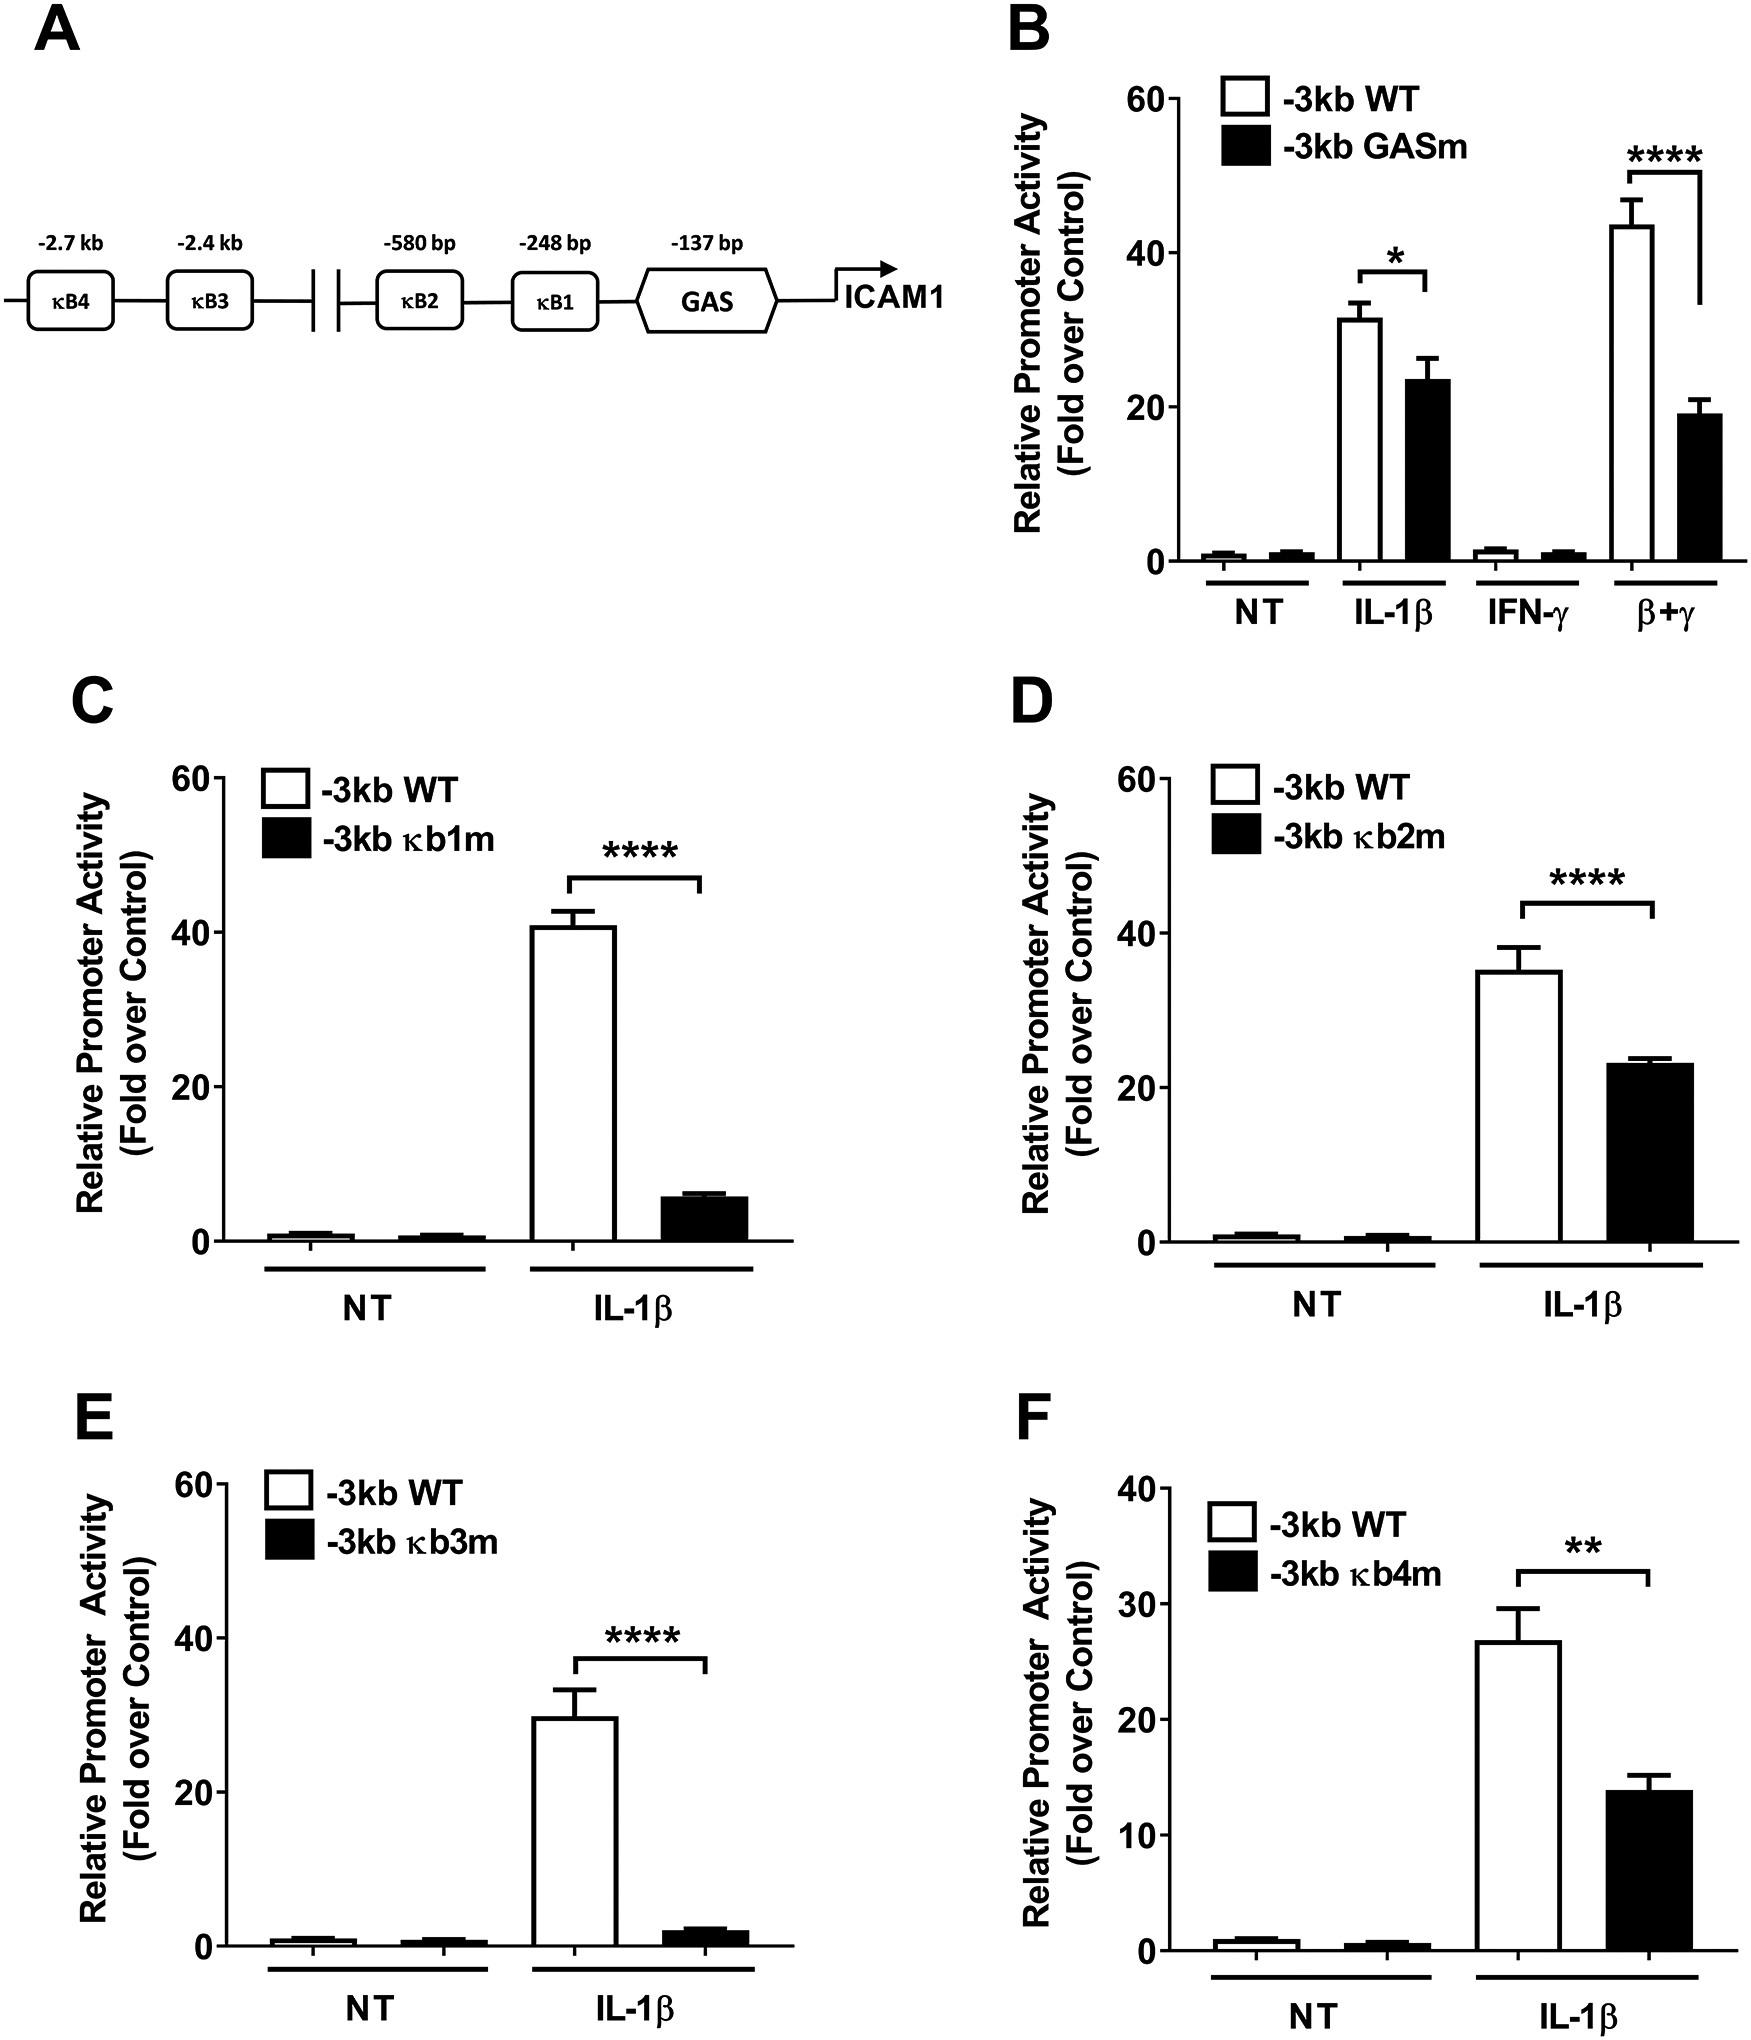
Figure 6. Site-directed mutation analyses within the Icam1 gene promoter reveal key genomic elements controlling transcriptional responses.

A. Schematic indicating the four computer software predicted NF-κB sites and one GAS element within the −3kb promoter region of the Icam1 gene. B-F. Promoter luciferase data obtained using either wild-type (WT) or promoter constructs with each individual predicted genomic element mutated. 832/13 cells were transfected with promoter luciferase plasmids. At 24 h post-transfection, the cells were either untreated (NT) or exposed to 1 ng/mL IL-1β, 100 U/mL IFN-γ, or both cytokines for 4 h. Data are shown as means of the luciferase signal normalized to the NT control for each group. Error bars represent standard error of the means. * p < 0.05, ** p < 0.01, **** p < 0.0001.
