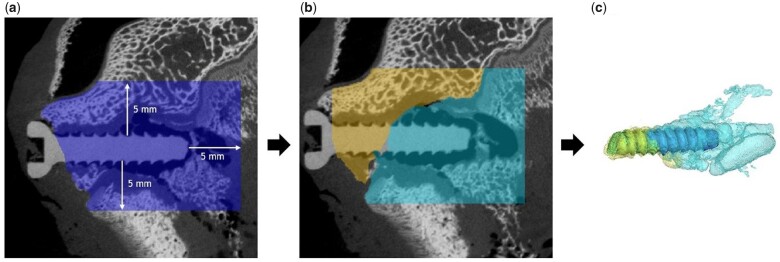
Figure 1.
Segmentation of implant and gas volume from µCT data. Total volume (in blue), which was considered for gas evaluation in the epiphyseal area, in a distance of 5 mm to the implant (a). Gas evolution within the soft tissue was not considered. The total volume was further divided into Sub-ROIs. In the epiphysis, it was distinguished between trabecular bone proximal (in turquois) and trabecular bone distal (in yellow) of the physis (b). Segmentation of implant and gas volume was performed for each region (c).

