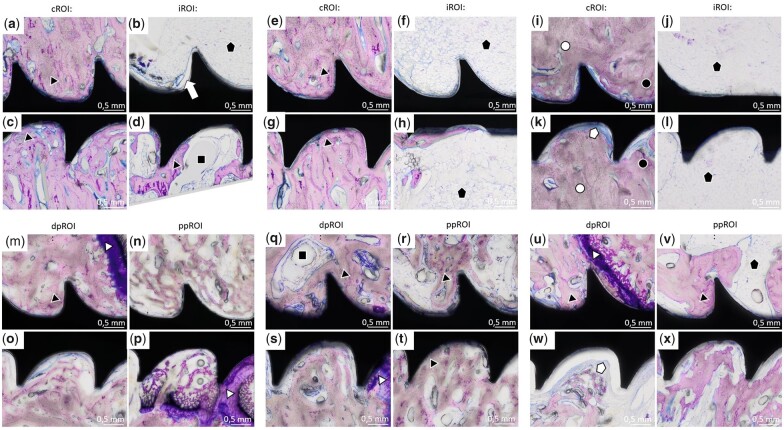
Figure 12.
Histology images of Ti-screws. Sections of iROI and cROI around Ti-screws 4 weeks (a–d), 6 weeks (e–h) and 12 weeks (i–l) after implantation, as well as dpROI and ppROI 4 weeks (m–p), 6 weeks (q–t) and 12 weeks (u–x) after implantation. Some void areas (black squares) were detected around the screws in all different ROIs. Direct BIC (black triangle) can be seen in all different ROIs at all time points. In iROI and cROI 12 weeks after implantation, it can be distinguished between old bone (white circle) and newly formed bone (black circle) (i and k). Fat cells (black pentagram) were mostly found in iROI (b, f, j, h and l), but were also detected in ppROI (v). In some areas, a small layer of connective tissue formed between bone and implant (k and w; white pentagram).

