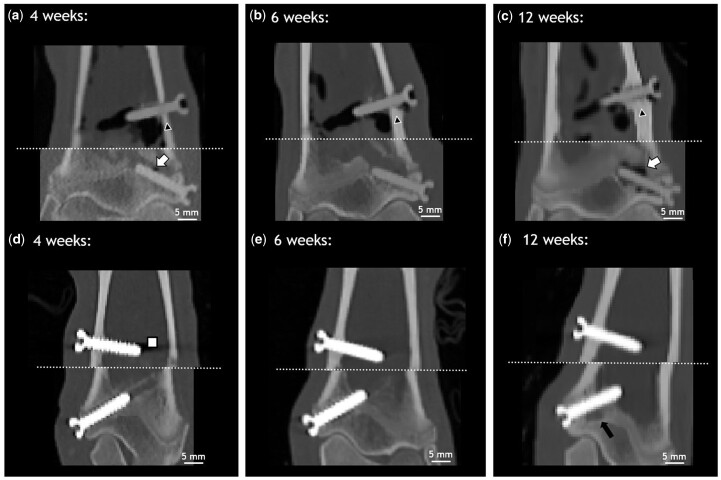
Figure 3.
In vivo cCT images of distal tibiae of one animal. ZX00 (a–c) and Ti (d–f) screws 4, 6 and 12 weeks after implantation are shown. White arrows indicate gas formation around the epiphyseal screw (a and c). Cortical thickness increases over time (a–c; black triangle). Some scanning artifacts (white square) were detected around the Ti-screws, mainly at the screw tip 4 weeks after implantation (d). Slight change in trabecular bone structure was detected below Ti-screw after 12 weeks (f; black arrow).

