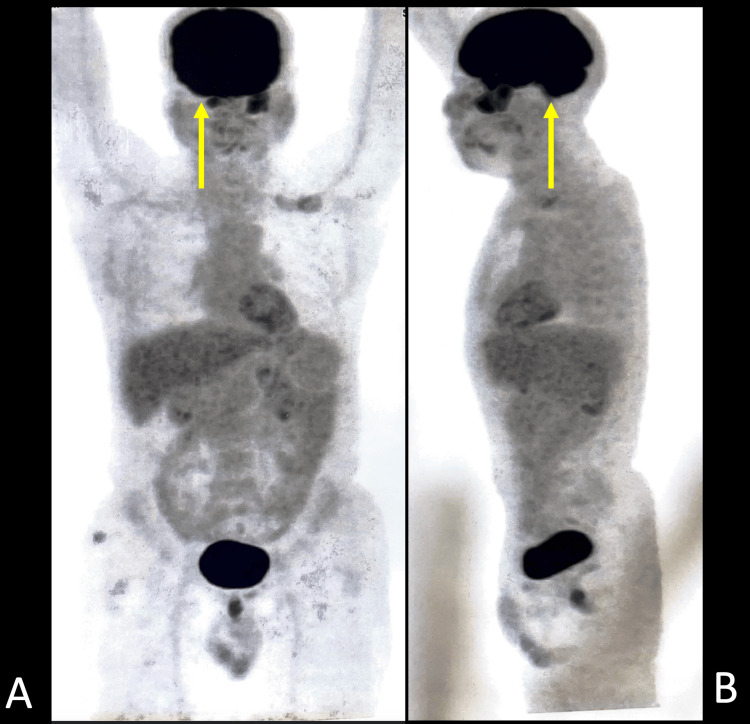
Figure 8. Positron emission tomography-computed tomography scan.
A. Coronal positron emission tomography-computed tomography scan showing increased metabolic activity in the head region (yellow arrow).
B. Sagittal Positron emission tomography-computed tomography scan showing increased metabolic activity in the head region (yellow arrow).

