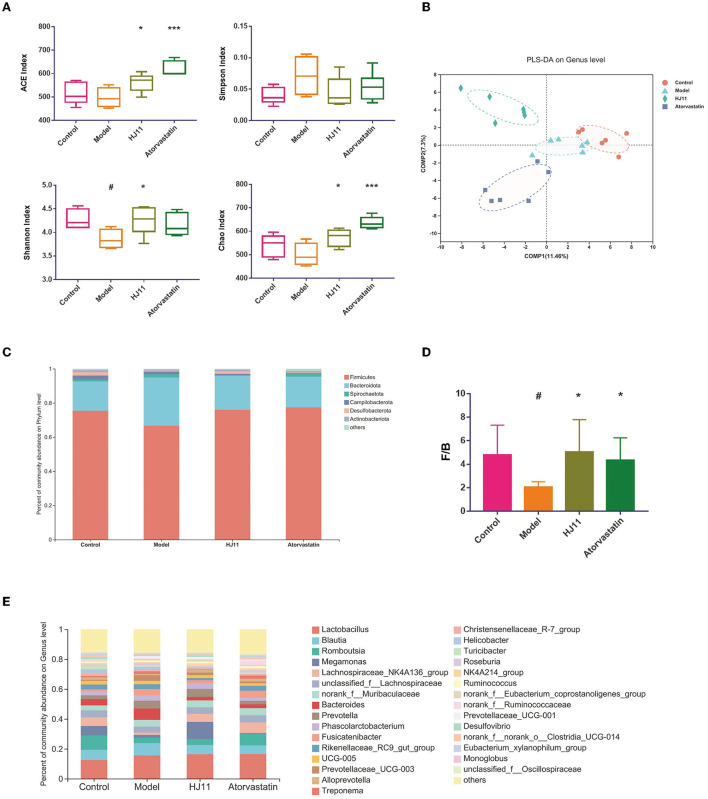
Figure 4.
Microbial community structures in different groups. (A) α-Diversity in different groups. (B) PLS-DA of different groups. Points with the same color and shape represent samples from the same group. Distances between points reflect differences between samples. (C) Comparison of community composition at the phylum level. Each column represents a group. (D) F/B ratio. (E) Comparison of community composition at the genus level. Each column represents a group. #P < 0.05, #P < 0.01 compared with the control group; *P < 0.05, ***P < 0.001 compared with the model group.

