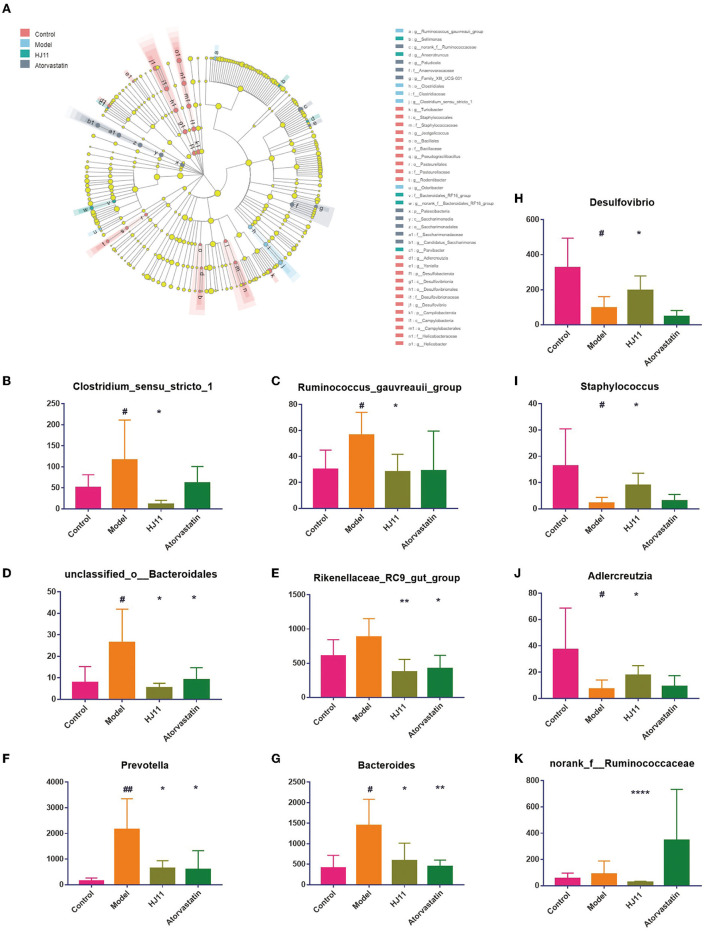
Figure 6.
Differentially abundant bacterial taxa. (A) Linear discriminant analysis effect size from the phylum to the genus level (LDA score > 2.0). (B–K) Relative abundances of gut bacterial genera that were significantly reversed by HJ11 treatment. Student's t-test, two-tailed. #P < 0.05, ##P < 0.01 compared with the control group; *P < 0.05, **P < 0.01, ****P < 0.0001 compared with the model group.

