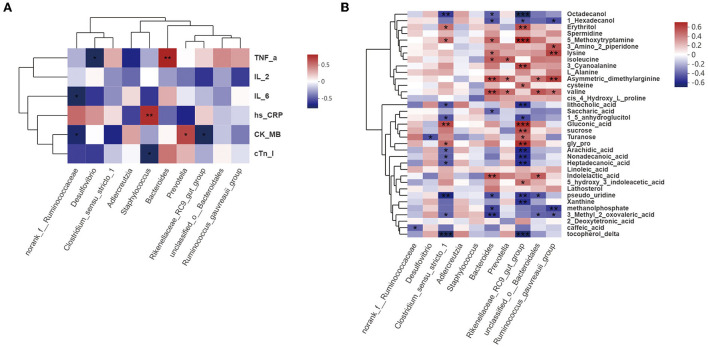
Figure 8.
Correlation analysis. (A) Correlations among gut bacteria, proinflammatory factors (TNF-α, IL-2, IL-6, and hs-CRP), and cardiac function indices (CK-MB and cTnI) (Spearman's r >0.1 or <0.1; n = 6/group). (B) Correlations among gut bacteria and metabolites (Spearman's r >0.1 or <0.1; n = 6/group). *P < 0.05, **P < 0.01, ***P < 0.001.

