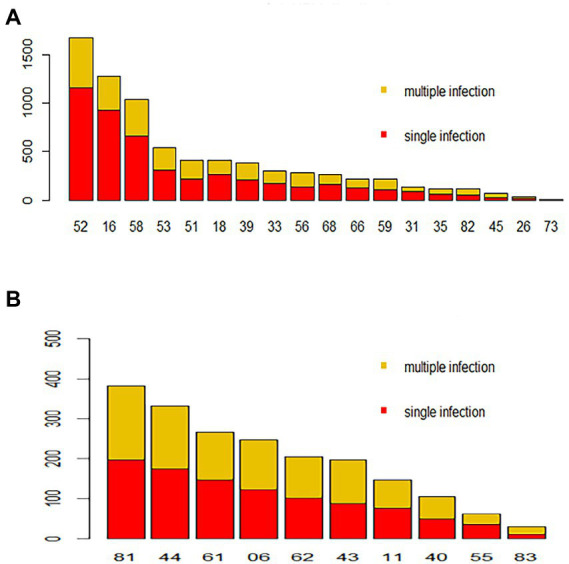
Figure 3.

Distribution of HPV genotypes during 2018–2020. Each bar represents the number of infections due to corresponding HPV genotypes. Red indicates the number of cases with only single-type infections for the corresponding HPV genotype, and yellow indicates the number of cases due to multiple infections. (A) High-risk HPV infection. (B) Low-risk HPV infection.
