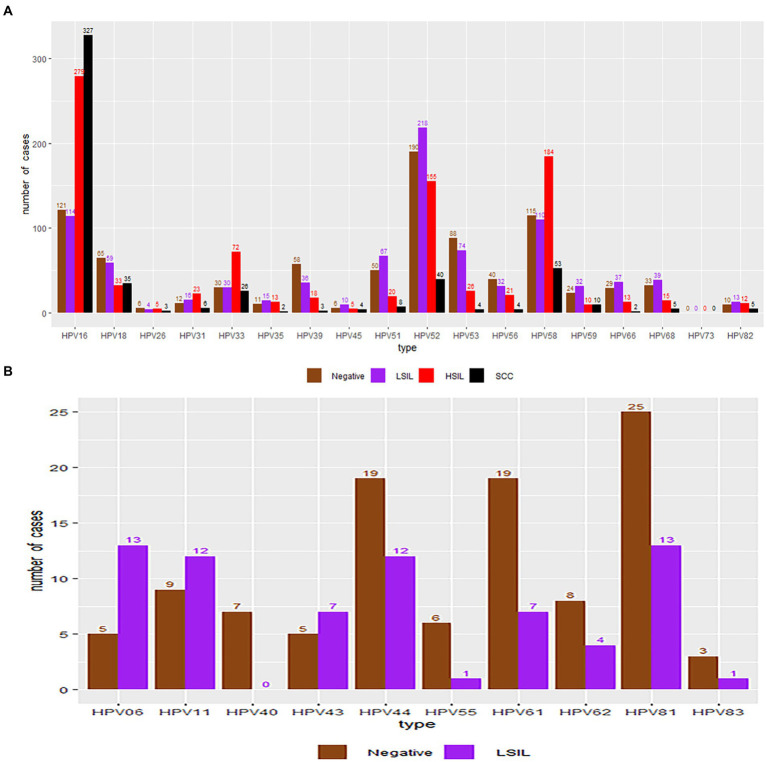
Figure 6.
HPV genotype infection rates in the negative, LSIL, HSIL and SCC groups. Each bar represents the number of infections due to the corresponding HPV genotypes. Grey, violet, red and black represent negative results, LSIL, HSIL and SCC for the corresponding genotype, respectively. (A) High-risk HPV genotypes with pathological results. (B) Low-risk HPV genotypes with pathological results.

