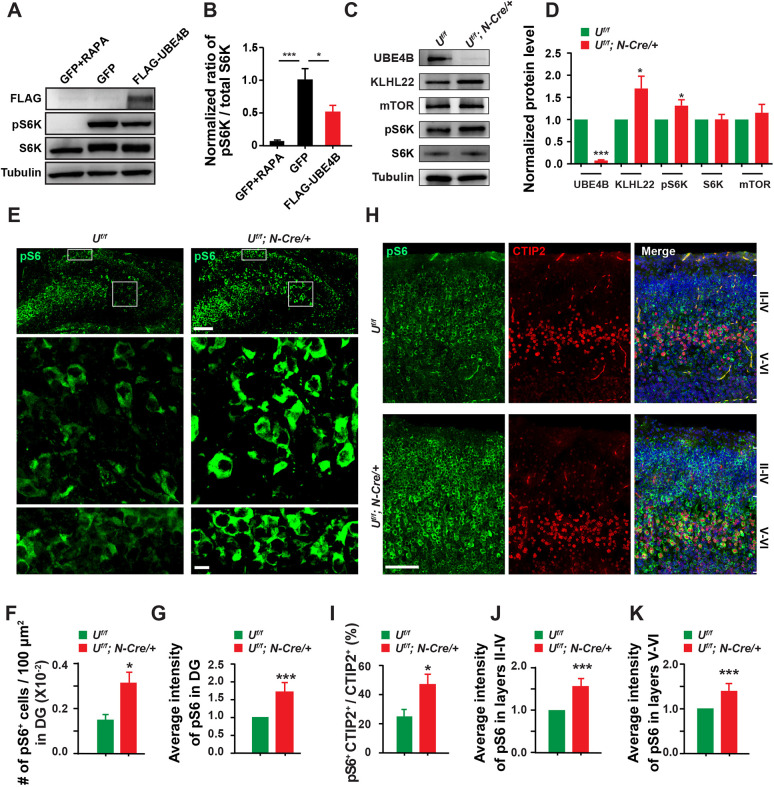
Fig. 4.
UBE4B suppresses phosphorylation of S6K and S6 in cultured cells and in the brain. (A) Overexpression of UBE4B inhibits phosphorylation of endogenous S6 kinase (S6K) in HEK293T cells. HEK293T cells were transfected with GFP or FLAG-UBE4B. Rapamycin (RAPA; 1 µM, 4 h) was applied to inhibit mTOR activity in GFP-expressing cells, which served as a negative control. Cells were collected and blotted with the indicated antibodies. (B) Quantification of the phosphorylated S6K (pS6K) levels shown in A. The ratio of pS6K over total S6K signals in GFP- or FLAG-UBE4B-transfected cells was normalized to that in rapamycin-treated cells. Three independent repeats were analyzed. Data represent mean±s.e.m. *P<0.05, ***P<0.001 (relative to the indicated controls; one-way ANOVA). (C) Accumulation of KLHL22 and enhanced phosphorylation of S6K in the Ube4b Nestin-CKO brain. An equal amount of P0 brain lysates were immunoblotted for UBE4B, KLHL22, mTOR, pS6K, S6K and tubulin antibodies. (D) Quantification of the indicated proteins in four pairs of P0 Ube4bf/f and Nestin-CKO littermates. Data represent mean±s.e.m. *P<0.05, ***P<0.001 (relative to the normalized protein levels in Ube4bf/ mice; unpaired, two-tailed Student's t-test). (E) Immunohistochemical detection of ribosomal protein S6 phosphorylation (pS6, Ser240/244) in the DG of P0 Ube4b Nestin-CKO mice. Boxed regions in the GCL and the hilus are magnified below. Scale bars: 200 μm (top); 20 μm (bottom). (F) Increased density of pS6+ cells in the DG of Ube4b Nestin-CKO mice. Brain slices from four pairs of P0 Ube4bf/f and CKO animals were counted and analyzed. (G) Increased pS6 intensity in pS6+ cells in the CKO DG. The average intensity of pS6 in pS6+ cells from four pairs of P0 Ube4bf/f and CKO littermates (n=221 and 256, respectively) was quantified. (H) Elevated phosphorylation of S6 in the S1 cortex in CKO animals at P0. Neurons in layer V were labeled by CTIP2 and all nuclei were stained by DAPI. The boundary of layers II-IV and layers V-VI was grossly defined based on CTIP2 and DAPI staining. Note that the distribution range of pS6+ cells was broader in CKO animals. Scale bar: 200 μm. (I) Increased ratio of pS6+ CTIP2+ cells in CTIP2+ cells in the S1 cortex. Brain slices from three pairs of P0 Ube4bf/f and CKO littermates were counted and analyzed. pS6 images from both groups were set to the same threshold. The ratio of pS6+ CTIP2+ cells in CTIP2+ cells was calculated as the number of CTIP2+ cells with pS6 signals above the threshold versus the total number of CTIP2+ cells. (J,K) Quantification of pS6 intensity in pS6+ cells in the layers II-IV (J) and V-VI (K). Cells from three pairs of P0 Ube4bf/f and CKO littermates were quantified (n=147 and 124, respectively, in J; n=178 and 165, respectively, in K). Data represent mean±s.e.m. *P<0.05, ***P<0.001 (relative to Ube4bf/f; unpaired, two-tailed Student's t-test).

