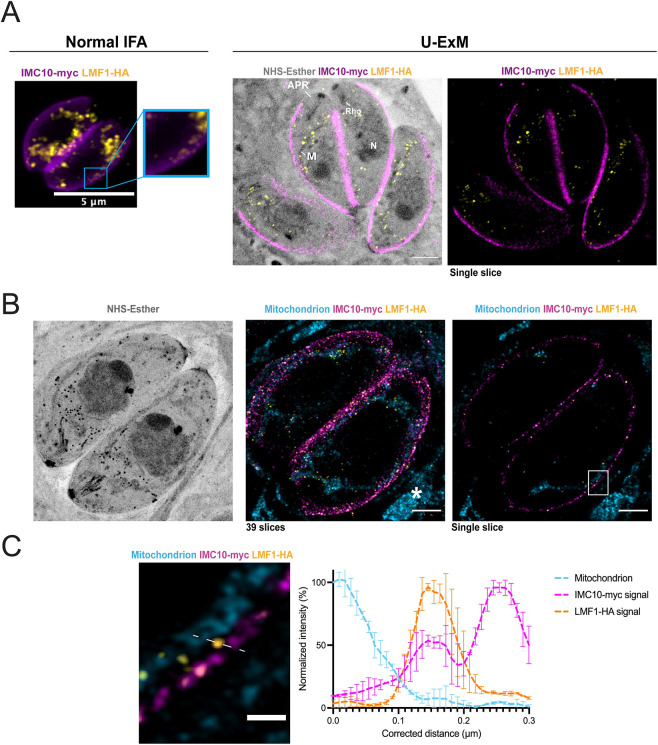
Fig. 2.
Expansion microscopy shows colocalization between IMC10 and LMF1. (A) Left, IFA of intracellular parasites stained with anti-HA (yellow) to detect LMF1 and anti-Myc (magenta) to detect the IMC. Box highlights a portion of the cell where the two signals are adjacent. Right, ultrastructure expansion microscopy (U-ExM) of intracellular parasites stained for LMF1–HA (yellow) and IMC10–Myc (magenta). On the right is the fluorescence signal showing the distribution of both proteins in the expanded parasites. On the left is an overlay of that image with the signal for NHS-ester, a total protein density marker. NHS staining allows for the visualization of structures such as the apical polar ring (APR), mitochondrion (M), rhoptries (Rho), and nucleus (N). (B) U-ExM panel of intracellular parasites. The left panel shows NHS staining. The center panel shows the Z-stacking of 39 slices of two parasites stained for the mitochondrion (cyan), LMF1–HA (yellow) and IMC10–Myc (magenta). Asterisks indicate the host cell mitochondrion. The right image is a single slice image. The white box highlights a region where the mitochondrion is in close contact with the IMC10 staining and LMF1. (C) Enlarged image of the boxed area showing the mitochondrion, LMF1 and IMC10 in close proximity to each other. The dashed line marks a region of proximity between signals, which was used to map fluorescence intensity for each signal. The graph shows the normalized fluorescence intensity (%) corresponding along the 0.3 µm line in the image on the left (real distance in the expanded image, ∼1.2 µm). Blue dotted line, mitochondrion signal; pink dotted line, IMC10 signal; yellow dotted line, LMF1 signal. The fluorescence intensity was calculated using ZEN Blue Software. Error bars indicate the s.d. of three independent measurements. See Movie 1 for the full Z-stack view. All images in this panel were acquired using both Zeiss LSM 800 (A panel) and 900 (B and C panel) with Airyscan processing. Results shown are representative of three repeats. Scale bars: 5 µm (A,B); 1 µm (C).

