Fig. 4.
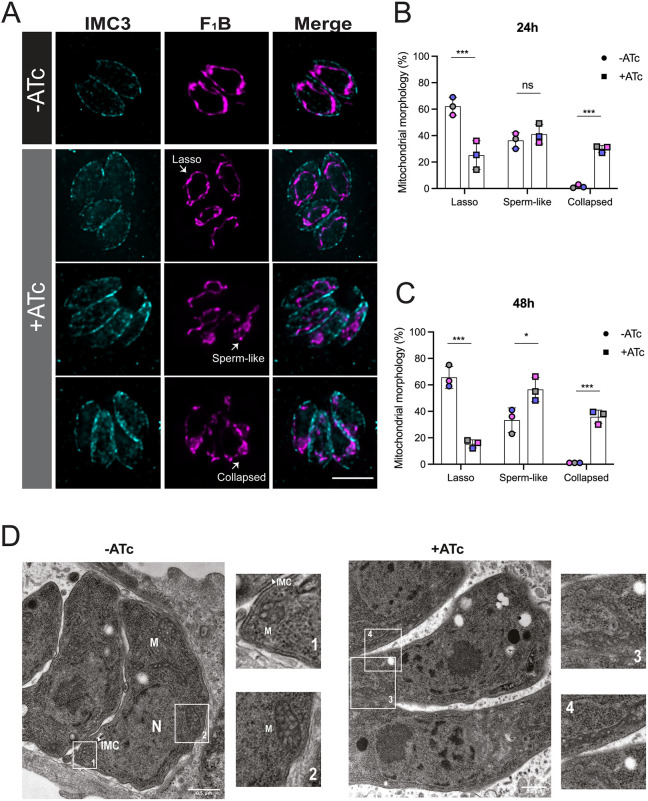
IMC10 knockdown disrupts mitochondrial morphology. (A) Intracellular parasites of the iKD-IMC10 strain were grown without (–) or with (+) ATc to regulate IMC10 expression. Parasites were stained for IMC3 (cyan) and F1B-ATPase (magenta). Images were taken 24 h post treatment. Scale bar: 5 µm. (B,C) Percentage of parasites with each of the three different morphologies for parasites grown in the absence and presence of ATc after 24 (B) and 48 h (C). Data are mean±s.d. of three replicates; at least 150 non-dividing vacuoles with intact IMC per sample were counted. ***P<0.001; *P<0.05; ns, not significant (P>0.05) (one-way ANOVA with Tukey post-correction). (D) Representative transmission electron microscopy (TEM) images of induced and non-induced cell lines 24 h post infection. Insets 1 to 4 show detailed structures, including the inner membrane complex (IMC), the nucleus (N), and the mitochondrion (M). IFA images were acquired using a Nikon 80i Eclipse. Images shown in D are representative of a single repeat. Scale bars: 500 nm.

