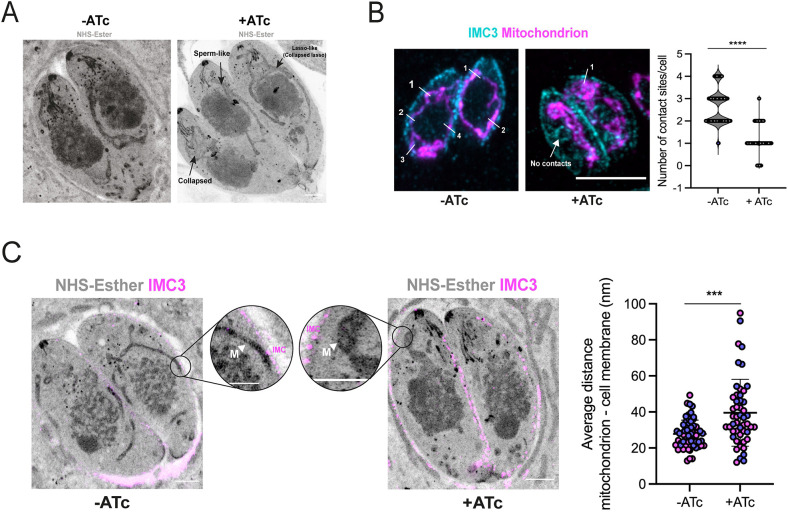
Fig. 5.
iKD-IMC10 cell lines show defects in mitochondrion position. (A) Representative figure of parasites in the presence or absence (control) of ATc visualized by ExM. Parasites were expanded and stained with NHS-ester (protein density marker) to highlight cellular structures. The three main mitochondrial phenotypes observed in the iKD-IMC10 in the presence of ATc are highlighted. (B) The mean±s.d. number of visible IMC–mitochondrion contacts. Vacuoles containing a maximum of 4 parasites were counted, a total of 50 parasites per replicate (n=3). ****P<0.0001 (one-way ANOVA with Tukey post-correction). (C) Average distance from the pellicle (represented by the IMC3 staining in magenta) to the mitochondrion (NHS staining) was calculated in the expanded parasites by measuring the distance between both organelles at their closest point (arrowhead indicates the mitochondrion). A total of 30 parasites were counted in two biological replicates (n=2). ***P<0.001 (one-way ANOVA with Tukey post-correction). Error bars represent s.d. Each replicate is represented by a different color. All images in the panels were acquired using a Zeiss LSM800 microscope with Airyscan processing and were taken 24 h post treatment. Scale bars: 5 µm.

