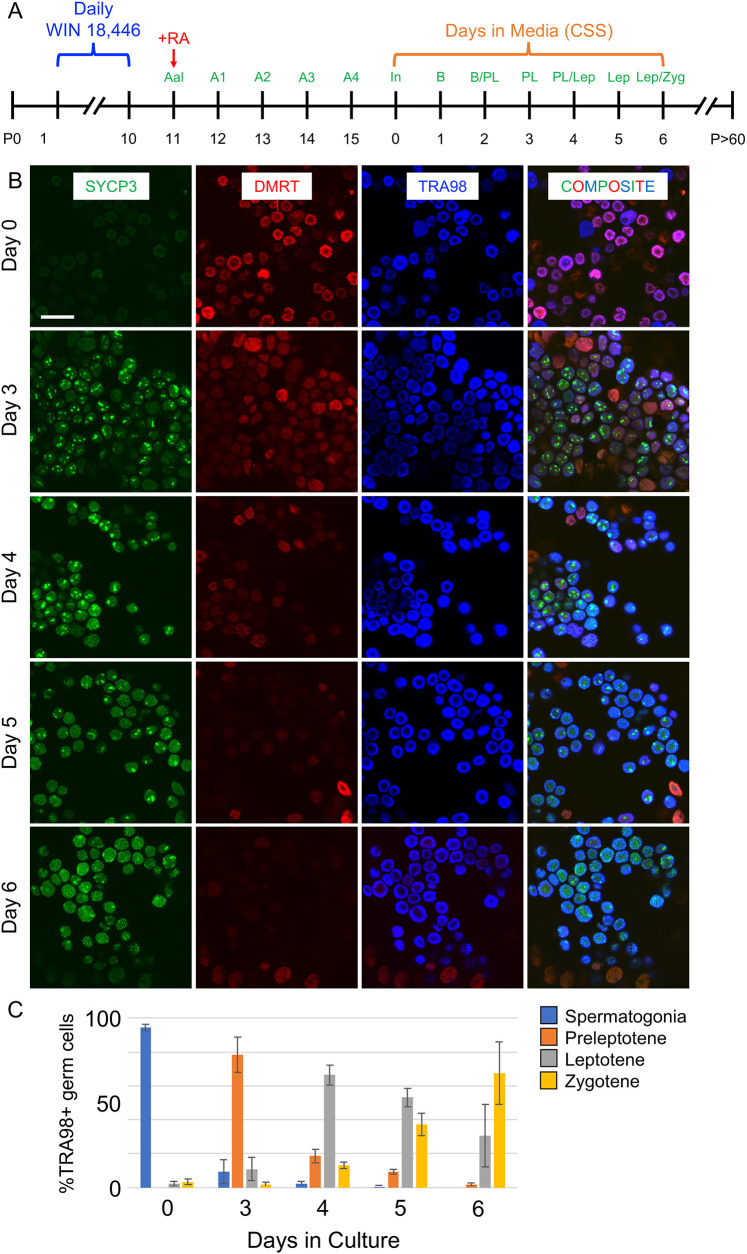
Fig. 2.
Modeling spermatogonial differentiation and meiotic initiation in vitro. (A) Timeline for synchronizing spermatogenesis in vivo prior to harvesting cells for in vitro cultures. (B) Immunostaining for protein fate markers at successive days of culture (indicated to the left of each row); the colors representing markers are indicated at the top of each column. (C) Quantitation of each germ cell type (premeiotic spermatogonia and preleptotene, leptotene and zygotene spermatocytes) is shown as a percentage of the entire germ cell population for each day of culture. Scale bar: 50 µm. The experiment was repeated five times (n=5) as separate biological replicates. Three technical replicates (n=3) were done for each biological replicate. Graphs represent mean±s.d. and error bars represent one s.d.

