
Fig. 3.
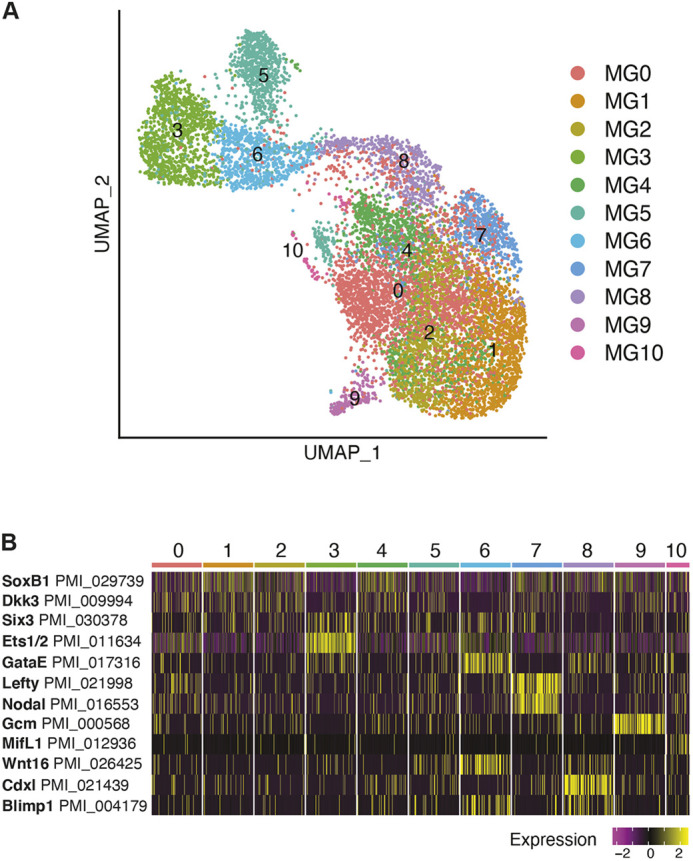
Gene expression at mid-gastrula stage. (A) UMAP plot of 10,448 mid-gastrula stage cells. Clusters colored by cell state identified by marker gene expression (Table S4). (B) Heatmap of mid-gastrula stage marker gene expression.
Official websites use .gov
A
.gov website belongs to an official
government organization in the United States.
Secure .gov websites use HTTPS
A lock (
) or https:// means you've safely
connected to the .gov website. Share sensitive
information only on official, secure websites.
Gene expression at mid-gastrula stage. (A) UMAP plot of 10,448 mid-gastrula stage cells. Clusters colored by cell state identified by marker gene expression (Table S4). (B) Heatmap of mid-gastrula stage marker gene expression.