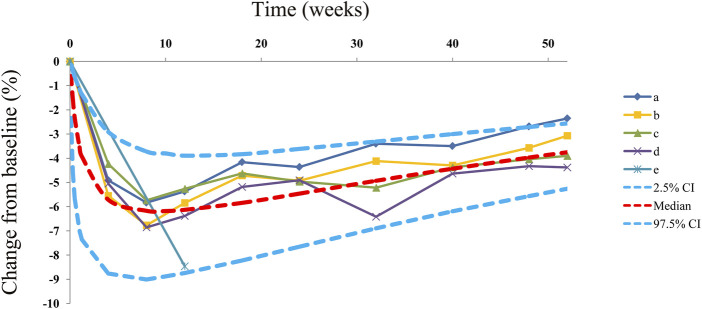
FIGURE 4.
Prediction-corrected visual predictive check plots. Median, 2.5% CI, and 97.5% CI were simulated using the Monte Carlo method (n = 1,000); CI, confidence interval. (a-e) Five dapagliflozin dosage groups from three randomized controlled trials (Kuhadiya et al., 2016; Dandona et al., 2018; Mathieu et al., 2020).

