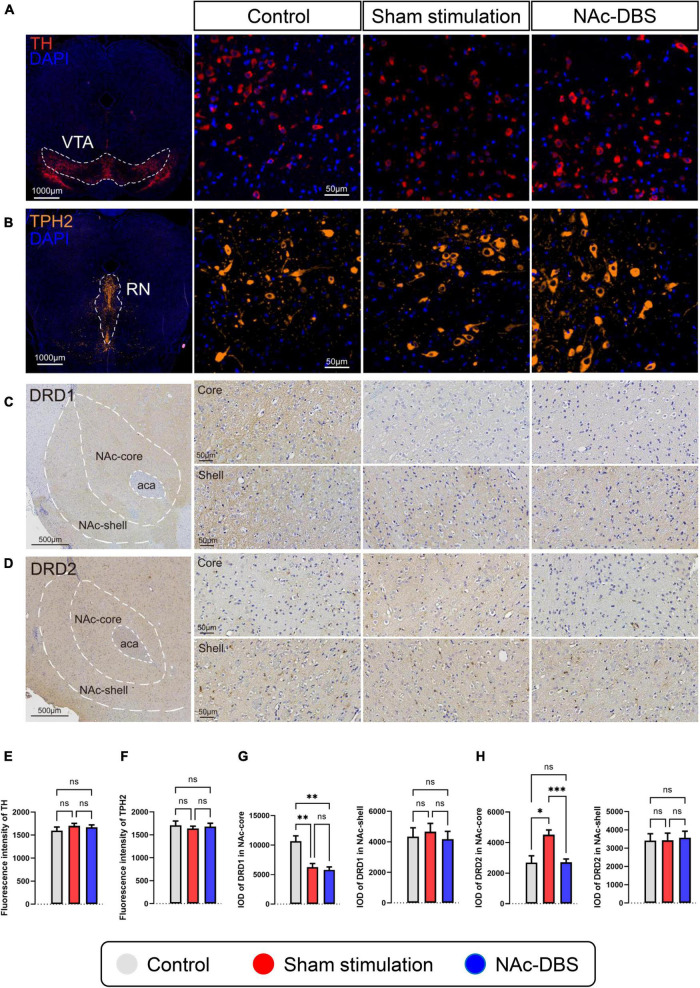
FIGURE 6.
Differences in pathological sections among the control, sham stimulation and NAc-DBS groups. (A) Immunofluorescence staining for TH was performed to label all dopaminergic neurons in the VTA. (B) Immunofluorescence staining for TPH2 was performed to label all serotonergic neurons in the RN. (C,D) Immunohistochemical staining for DRD1 and DRD2 in the NAc. The top image is the NAc core, and the bottom image is the NAc shell. (E) The bar graph represents the mean level of the immunofluorescence intensity of TH in the VTA. (F) The bar graph represents the mean level of the immunofluorescence intensity of TPH2 in the RN. (G) The bar graphs represent the mean level of IOD of DRD1 in the core and shell of the NAc. (H) The bar graphs represent the mean level of IOD of DRD2 in the core and shell of the NAc. VTA, ventral tegmental area; TH, tyrosine hydroxylase; RN, raphe nuclei; TPH2, tryptophan hydroxylase-2; NAc, nucleus accumbens; DRD1, dopamine receptor-1; DRD2, dopamine receptor-2; IOD, integrated optical density. The data are presented as the mean ± SEM; n = 10 vs. n = 19 vs. n = 19 (immunofluorescence); n = 8 vs. n = 17 vs. n = 15 (immunohistochemistry); ***P < 0.001, **P < 0.01, *P < 0.05; ns, no significance.

