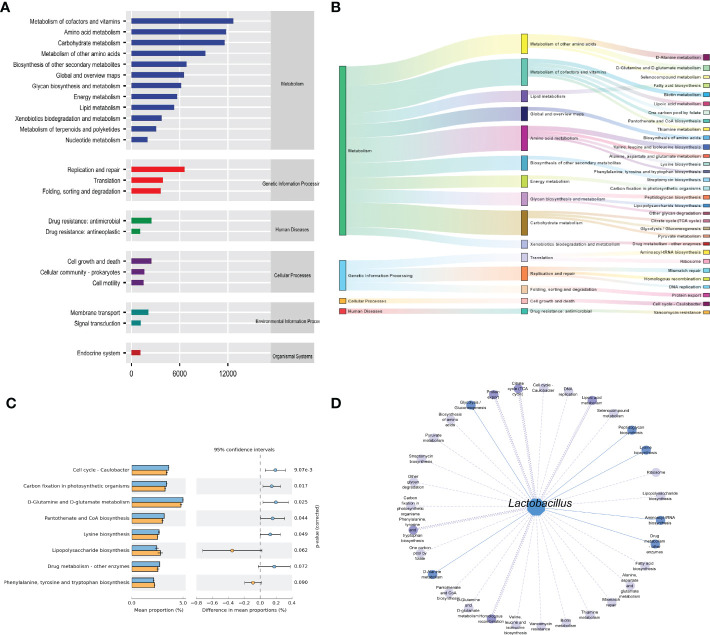
Figure 6.
Functional analysis of intestinal mucosal microbiota. (A) Predictive abundance diagram of function. (B) Sankey diagram. (C) Predictive abundance diagram of function. (D) Interaction network of “Lactobacillus-function.” Solid lines indicate a positive correlation, and dotted lines are negative correlations. The line width stated the strength of the correlation.

