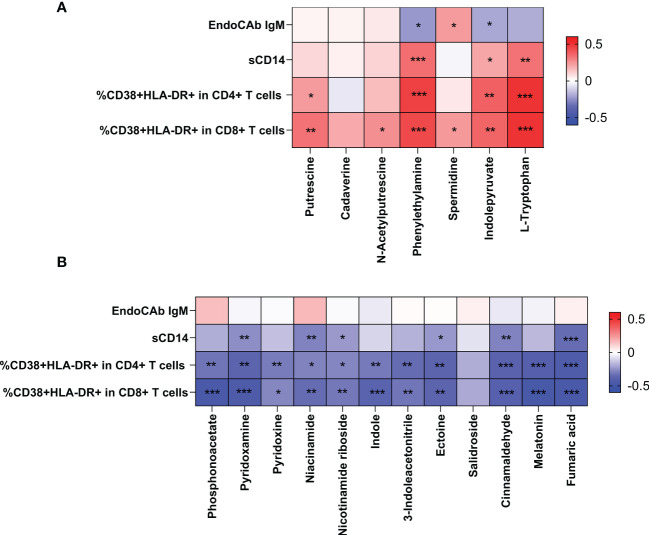
Figure 6.
Correlation of the differential metabolites with immune activation and microbial translocation. The positive Spearman rank correlation coefficients are denoted by red squares, and negative correlation coefficients by blue squares. The metabolites, exhibited higher levels in HIV-positive individuals, were positively correlated with microbial translocation and immune activation (A). In contrast, metabolites, exhibited lower levels in HIV-positive individuals, were negatively correlated with immune activation and microbial translocation (B). *: 0.010 ≤ P < 0.050; **: 0.001 ≤ P < 0.010; ***: P < 0.001.

