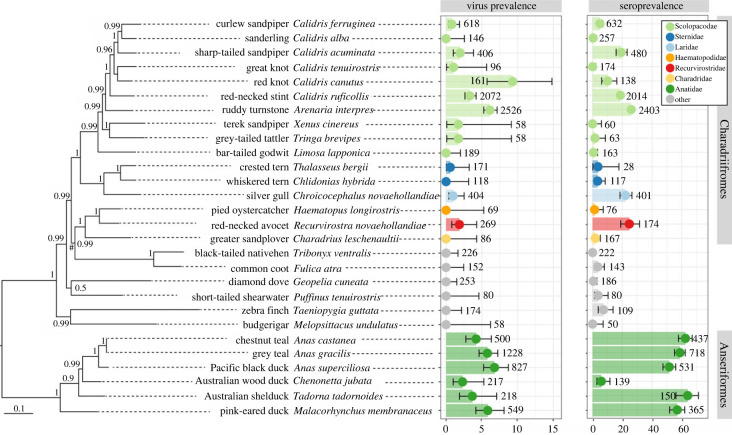
Figure 2.
Prevalence and seroprevalence in Anseriformes and Charadriiformes. Host species are arranged taxonomically, according to maximum-likelihood phylogenies based on concatenated mitochondrial and one nuclear marker. Bayesian support values are presented at the node, and the scale bar indicates the number of substitutions per site. The hash symbol (#) refers to a node on the tree which does not conform to known phylogenetic relationships, and we were unable to resolve this discrepancy based on available host genetic data in GenBank. Species from which greater than 50 samples were collected are included, and percentage prevalence and 95% confidence intervals are plotted. Colours refer to host families in the order Anseriformes and Charadriiformes; host families from other orders are in grey. Sample size is plotted adjacent to the point estimate. Seroprevalence refers to the percentage prevalence of anti-NP antibodies in collected serum samples. Virus prevalence refers to the percentage prevalence of LPAIV by the use of qPCR. While we show seroprevalence for crested tern in this figure for clarity, it was not included in the seroprevalence all-species analysis due to low sample size (less than 50).

