Figure 1.
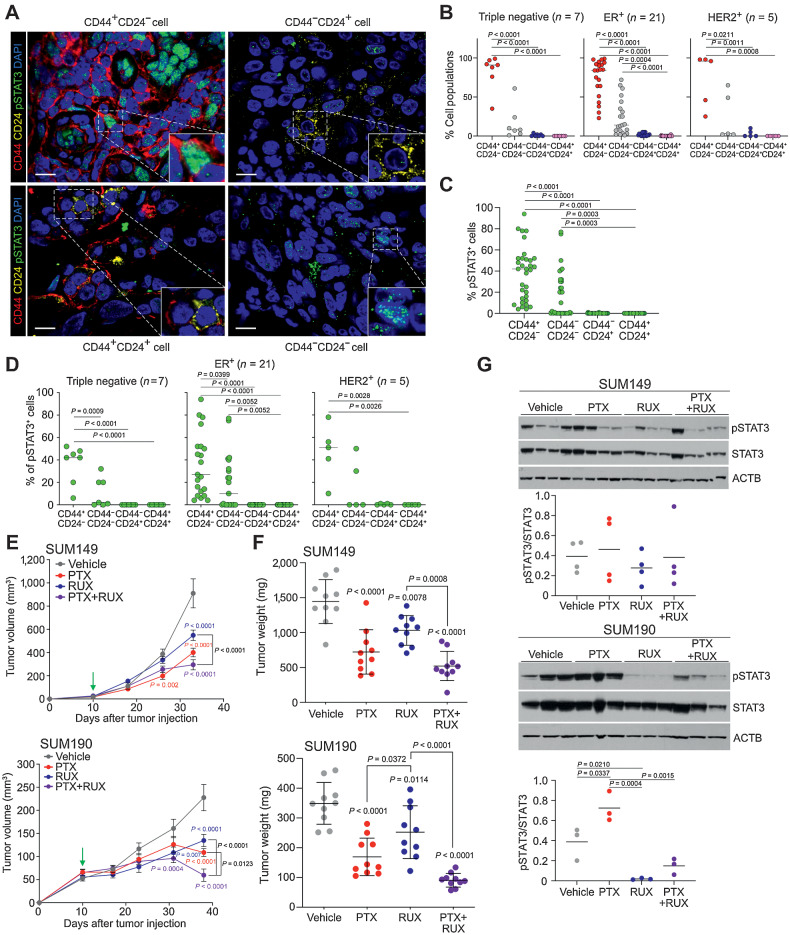
Frequency of CD44+CD24−pSTAT3+ cells and dependency on JAK/STAT3 signaling in IBC. A, Representative immunofluorescence analysis of CD44, CD24, and pSTAT3 in IBC samples. Scale bars, 10 μm. Nuclei were stained with DAPI. B, Percent of the four cell types in each IBC tumor of the indicated subtype. C, Percent pSTAT3+ cells in the four cell types (n = 33 patients). D, Percent pSTAT3+ cells within the four cell types in each tumor classified by subtype. E, Graphs depicting SUM149 (top) and SUM190 (bottom) xenograft tumor volume in mice treated with vehicle, paclitaxel (PTX), ruxolitinib (RUX), or the combination, with green arrow depicting treatment start when tumors were first palpable (∼20 mm3 for SUM149 and ∼60 mm3 for SUM190). Error bars, SEM; n = 5 mice with 2 tumors/mouse. P values were calculated by two-way ANOVA. F, Graph of tumor weights at endpoint from experiment shown in E. Error bars, SD. G, Immunoblot analysis of pSTAT3 and STAT3 in xenografts. ACTB was used as a loading control. Dot plot depicts quantification of pSTAT3/STAT3 ratios. P values for B–D and F–G calculated by one-way ANOVA with Tukey multiple comparisons.

