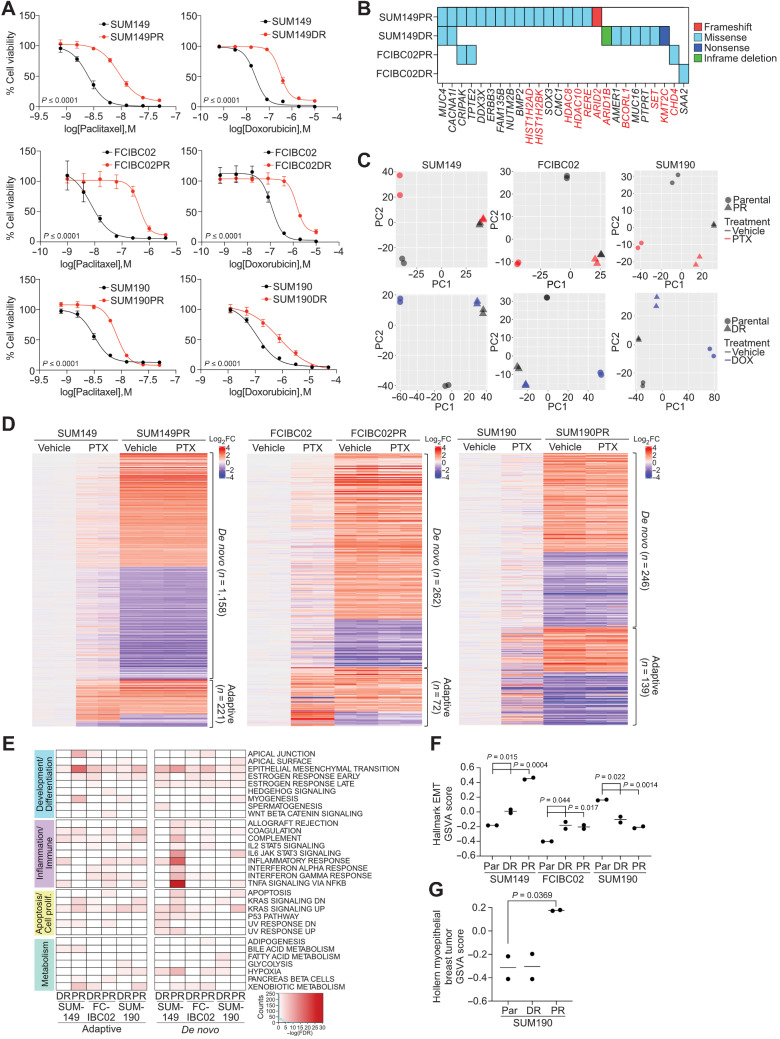
Figure 2.
Characterization of chemotherapy-resistant IBC cell lines. A, Cellular viability after paclitaxel or doxorubicin treatment of parental and resistant cells. Error bars, SD (n = 3). P values determined by comparison of curves using F test. B, Selected genes from Supplementary Fig. S2A, which were mutated in resistant derivatives and either overlapped with the COSMIC cancer database, were differentially expressed in pathway analysis, or were mutated in both paclitaxel-resistant cell lines. Highlighted genes in red correspond to chromatin modifiers. C, Principal component analysis of gene expression of parental and resistant cell lines treated with vehicle, paclitaxel (PTX), or doxorubicin (DOX). D, Heat map of significant differentially expressed genes between parental and resistant derivatives clustered by either their presence (adaptive) or absence (de novo) in parental paclitaxel treated cells compared with vehicle. E, Gene set enrichment analysis for Hallmark gene sets in the indicated resistant versus parental differential gene lists that were significantly enriched (FDR < 0.05). Color scale corresponds to −log(FDR q-value). F, Gene set variation analysis (GSVA) score showing relative enrichment of the Hallmark EMT gene set in the indicated cell lines. G, GSVA analysis as in F for enrichment of the Hollern Myoepithelial Breast Tumor gene signature in SUM190 cell lines. P values for F and G calculated by Student t test.

