. 2022 Nov 21;83(2):264–284. doi: 10.1158/0008-5472.CAN-22-0423

Figure 3.

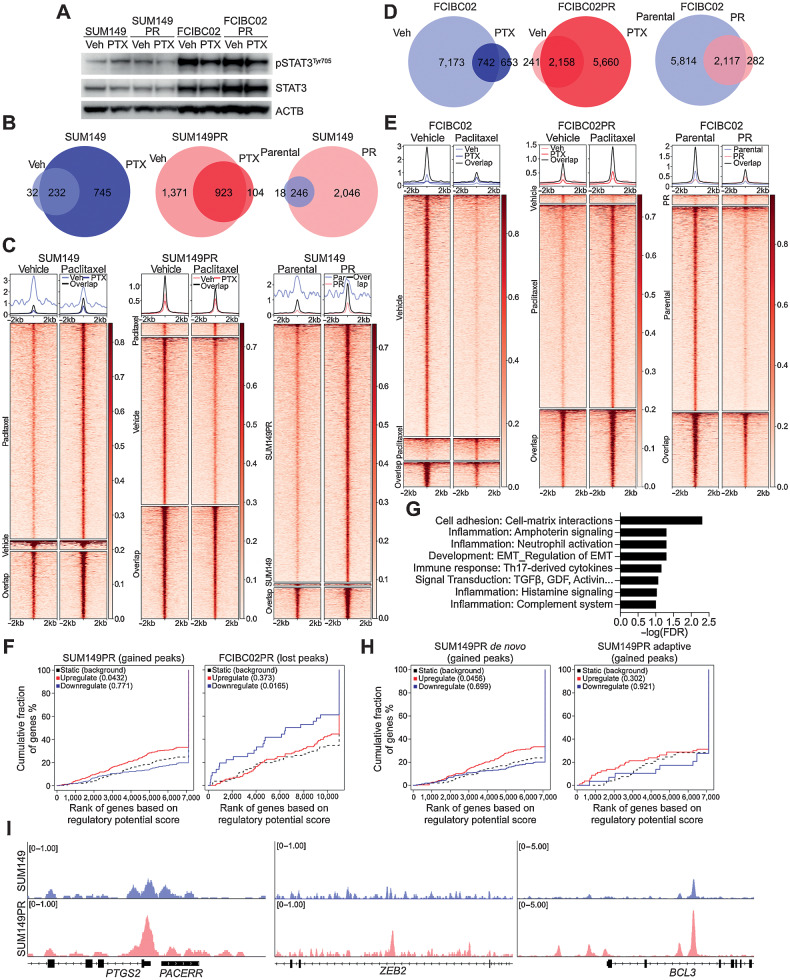
Figure 3. pSTAT3 chromatin binding patterns in drug-sensitive and -resistant IBC cells. A, Western blot analysis of pSTAT3Tyr705, and STAT3 in the indicated cell lines following 24 hours of paclitaxel (PTX) treatment. ACTB used as loading control B, Venn diagram depicting overlap of pSTAT3Tyr705 ChIP-seq peaks between vehicle (Veh) and paclitaxel (PTX) treatment of SUM149 and SUM149PR cell lines. C, Heat map depicting pSTAT3Tyr705 peaks which are unique in vehicle (Veh) and paclitaxel (PTX) treated SUM149 and SUM149PR cells and the overlap between groups. The color key is the score of ChIP-seq signal over the selected genomic region, the signals across different genomic regions have been scaled to the same length. D, Venn diagram depicting overlap of pSTAT3Tyr705 peaks between Veh and PTX treatment of FCIBC02 and FCIBC02PR. E, Heat map of pSTAT3Tyr705 peaks in FCIBC02 and FCIBC02PR as shown in C. F, Integration of differential gene expression and pSTAT3Tyr705 targets by BETA analysis. The P value listed in the top left represents the significance of the up or down group relative to the unchanged (NON) group as determined by the Kolmogorov–Smirnov test. G, Process networks significantly enriched (FDR < 0.1) in genes that are upregulated in SUM149PR compared with SUM149 and are pSTAT3 targets only in SUM149PR cells. FDR calculated by MetaCore Enrichment Analysis test. H, BETA analysis as shown in F of integration of pSTAT3 targets and differentially expressed genes in either adaptive or de novo clusters as defined in Fig. 2D. I, Gene tracks depicting pSTAT3Tyr705 signal at selected genomic loci. X-axis shows position along the chromosome with gene structures drawn below. Y-axis shows genomic occupancy in units of rpm/bp.

pSTAT3 chromatin binding patterns in drug-sensitive and -resistant IBC cells. A, Western blot analysis of pSTAT3Tyr705, and STAT3 in the indicated cell lines following 24 hours of paclitaxel (PTX) treatment. ACTB was used as loading control B, Venn diagram depicting overlap of pSTAT3Tyr705 ChIP-seq peaks between vehicle (Veh) and paclitaxel (PTX) treatment of SUM149 and SUM149PR cell lines. C, Heat map depicting pSTAT3Tyr705 peaks, which are unique in vehicle (Veh)- and paclitaxel (PTX)-treated SUM149 and SUM149PR cells and the overlap between groups. The color key is the score of ChIP-seq signal over the selected genomic region; the signals across different genomic regions have been scaled to the same length. D, Venn diagram depicting overlap of pSTAT3Tyr705 peaks between Veh and PTX treatment of FCIBC02 and FCIBC02PR. E, Heat map of pSTAT3Tyr705 peaks in FCIBC02 and FCIBC02PR as shown in C. F, Integration of differential gene expression and pSTAT3Tyr705 targets by BETA analysis. The P value listed in the top left represents the significance of the up or down group relative to the unchanged (NON) group as determined by the Kolmogorov–Smirnov test. G, Process networks significantly enriched (FDR < 0.1) in genes that are upregulated in SUM149PR compared with SUM149 and are pSTAT3 targets only in SUM149PR cells. FDR calculated by MetaCore Enrichment Analysis test. H, BETA analysis as shown in F of integration of pSTAT3 targets and differentially expressed genes in either adaptive or de novo clusters as defined in Fig. 2D. I, Gene tracks depicting pSTAT3Tyr705 signal at selected genomic loci. X-axis shows position along the chromosome with gene structures drawn below. Y-axis shows genomic occupancy in units of rpm/bp.