Figure 4.
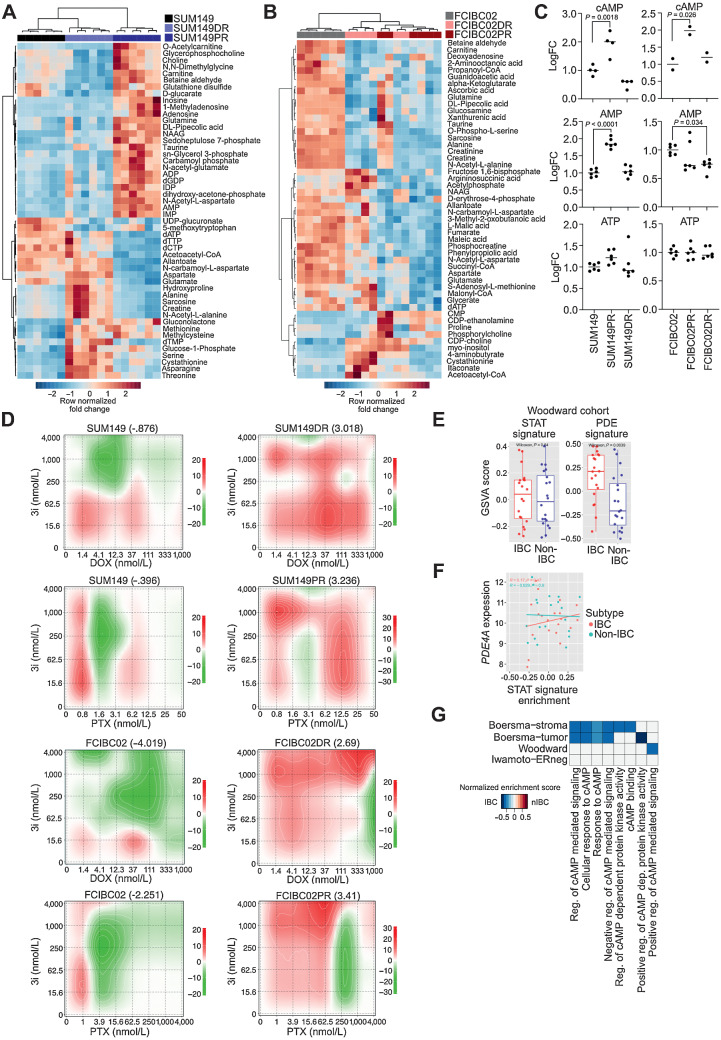
Metabolic reprogramming and upregulation of cAMP signaling in IBC resistance. A and B, Fold change metabolite abundance over SUM149 Parental (A) or FCIBC02 Parental (B) for top 50 differential metabolites in doxorubicin-resistant and paclitaxel-resistant cells as measured by LC/MS-MS. C, Relative abundance of cAMP, AMP, and ATP by LC/MS-MS (n = 6). P values calculated by one-way ANOVA. D, Synergy scores for cell lines treated with paclitaxel (PTX) or doxorubicin (DOX) in combination with the CREB inhibitor 3i (n = 3). Synergy was calculated using ZIP model where a score of 0 indicates an additive response and areas of red and green indicate synergistic and antagonistic dose regions, respectively. E, PDE gene-family and STAT (generated from KEGG) gene signature scores in a patient cohort (Woodward) featuring IBC and non-IBC patient samples. F, Correlation between STAT signature generated from KEGG and PDE4A expression in the Woodward cohort. G, Gene set enrichment scores of gene ontology cAMP-related pathways in IBC versus non-IBC (nIBC) patient samples (FDR < 0.1).

