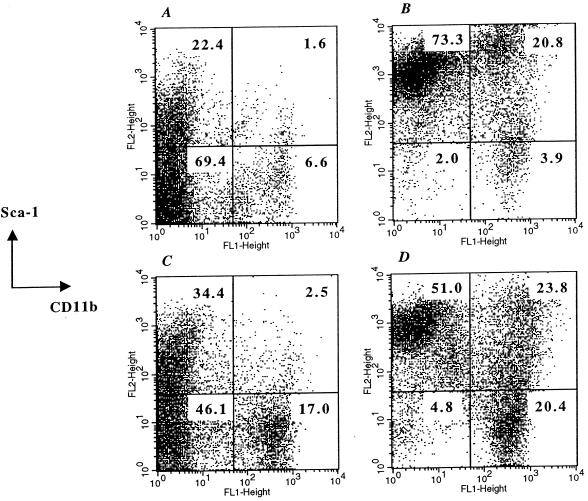
FIG. 3.
Phenotypic analysis of spleen cells. Single-cell suspensions were prepared from spleens of animals immunized 7 days previously with either PBS (A), BRD509 (B), GIDIL2 (C), or GIDTNF (D). The results are shown as dot plots depicting staining with Sca-1 versus CD11b. The cell percentages within each quadrant are given in the figure. Data from a total of 25,000 cells per group were collected and analyzed. The results are representative of four independent experiments.

