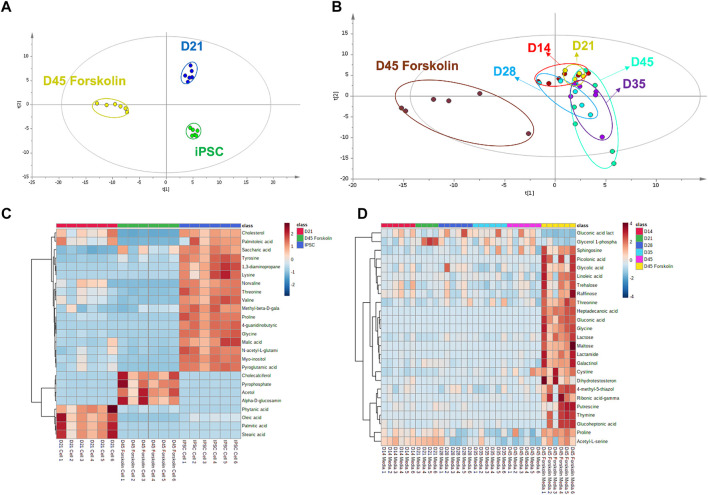
FIGURE 7.
Metabolomic analysis of cell and culture medium (A) PLS-DA score plot for metabolomic profiles of cell lines at different time points and presence of the stimulant (R 2 = .820 and Q2: .978) (B) PLS-DA score plot for exometabolomic profiles of cell culture mediums (R 2 = .410 and Q2: .117) (C) Heat map for cell metabolites (D) Heat map for cell culture medium metabolites (n = 6 biological replicates).

