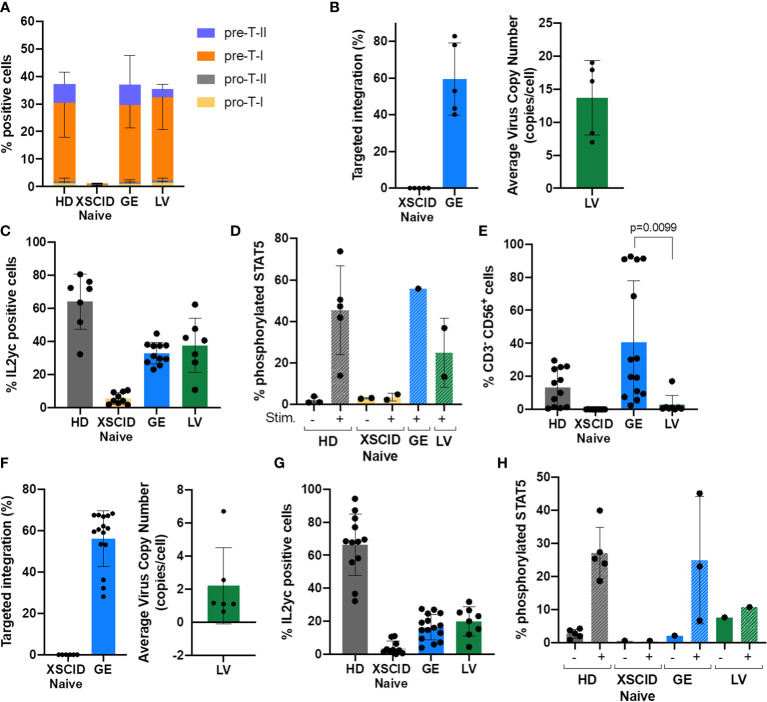
Figure 3.
Evaluation of in vitro development of T and NK cells from GE- or LV-treated XSCID HSPCs and phenotypic/functional characterization. (A) Bar graph showing the relative proportion of CD34-derived T progenitors and precursor cells in each condition measured by flow cytometry at week 6 of in vitro differentiation (n = 9 independent experiments). (B) Percentage of TI and VCN quantified by ddPCR at week 6 of in vitro T cell differentiation (n = 5 independent experiments). (C) Percentage of T cells expressing IL2γc measured by flow cytometry at week 6 of in vitro differentiation (n = 7 independent experiments). (D) Percentage of T cells with phosphorylated STAT5 after 15min of stimulation with IL2/IL7 (+) or left unstimulated (-) (n = 1-4 independent experiments). (E) Bar graph showing the percentage of CD34-derived NK cells (CD3-CD56+) in each condition measured by flow cytometry at day 35 of in vitro NK differentiation (n = 12 independent experiments). (F) Percentage of TI and VCN quantified by ddPCR at day 35 of in vitro NK differentiation (n = 12 independent experiments). (G) Percentage of cells expressing IL2γc measured by flow cytometry in NK cells at day 35 of in vitro differentiation (n = 12 independent experiments). (H) Percentage of NK cells with phosphorylated STAT5 after 15min of stimulation with IL2/IL15 (+) or left unstimulated (-) (n = 3-5 independent experiments).

