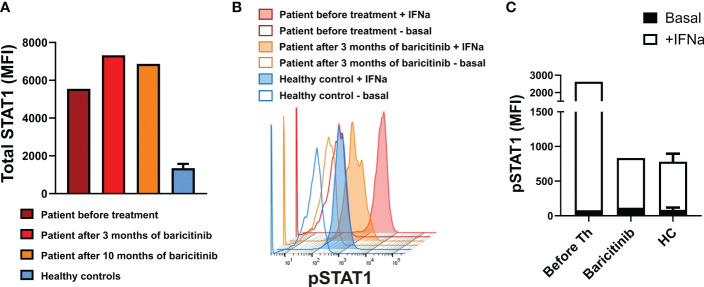
Figure 2.
(A): Total STAT1 levels in CD4+ T lymphocytes from the patient on indicated time points and healthy controls. (B) Phosphorylated STAT1 (pSTAT1) levels in unstimulated whole-blood CD4+ T lymphocytes and on interferon (IFN)-α induction. (C) Basal (unstimulated) pSTAT1 levels and pSTAT1 levels on stimulation with IFN-α for 15 minutes in CD4+ T lymphocytes from the patient before treatment and after 3 months of baricitinib, and from healthy controls. Values in (A) and (C) for healthy controls (n=3) are the mean ± SD. MFI, median fluorescence intensity; HC, healthy controls.

