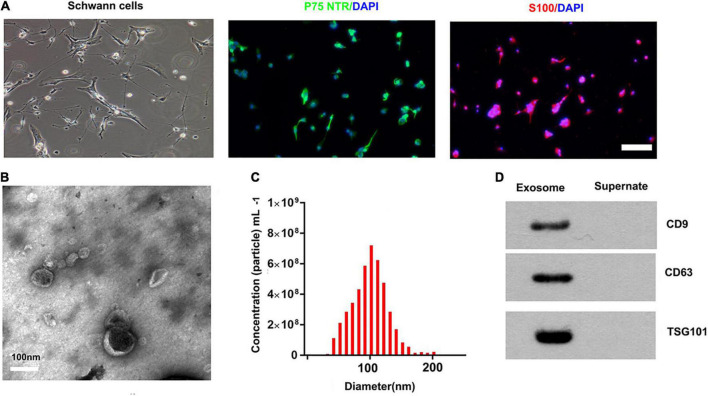
FIGURE 1.
Characterization of SCs and derived exosomes. (A) Phase contrast image of the Schwann Cells (SCs). Immunofluorescence stain of the surfer markers-P75NTR (green) and S100 (red) of SCs. Scale bar = 100 μm. (B) The Transmission electron micrograph of exosomes, Scale bar = 100 nm. (C) The nanoparticle tracking analysis of the exosomes. (D) The specific surface markers of exosomes, such as CD9, CD63, and TSG101 were then confirmed by Western blotting.

