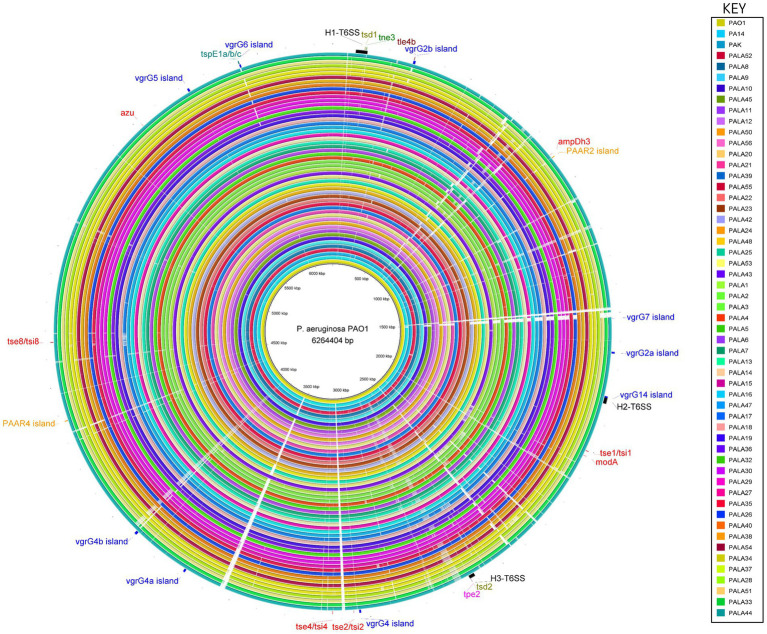
Figure 6.
Comparative analysis of PAO1 to 52 clinical isolates under study and reference strains PA14 and PAK using the BLAST Ring Image Generator (BRIG) shows conservation of the genomes, and location, distribution and variation of T6SS genes. The innermost ring represents the genomic sequence of PAO1, followed by PA14 and then PAK. The remaining concentric rings represent the isolate sequences coloured according to the key. The intensity of the coloured ring signifies the genetic similarity of the reference sequence (PAO1) to the compared isolate (e.g., gaps = <50% similarity at the specific genomic loci). T6SS clusters, islands and effectors are labelled at the respective genomic loci in the reference strain PAO1. Central T6SS gene clusters are coloured black, vgrG islands are blue, PAAR islands are orange, and orphan effectors are red. The positions of the genes encoding the eight putative T6SS effectors described in this study are colour coded: putative cytidine deaminases (tsd1/tsd2) are olive, putative NADase (tne3) are green, putative lipases (tle4b) are maroon, putative metallopeptidase (tpe2) are pink, and putative pyocins are teal (tspE1a/b/c). The figure was produced using BRIG (Alikhan et al., 2011).

