Figure 3.
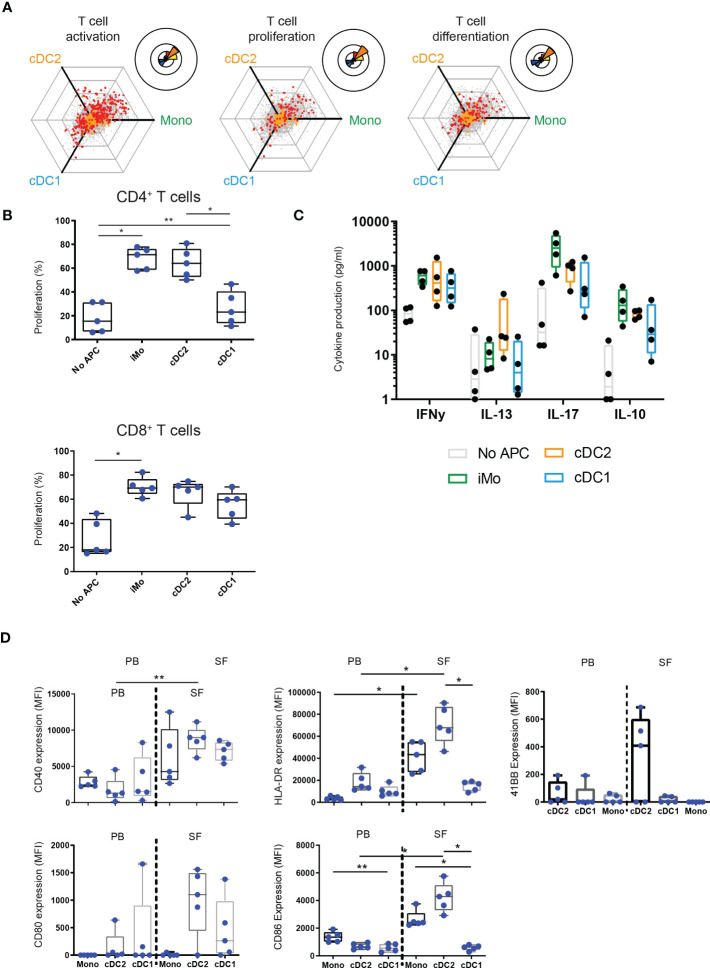
Functionally, cDC1 are weak inducers of T cells compared to cDC2 and monocytes. (A) Hexagon and rose diagrams of DE genes measured (red dots) that, as defined by Gene Ontology annotation, have been associated with T cell activation (left panel), T cell proliferation (middle panel), and T cell differentiation (right panel). (B, C) Proliferation of CD4+ (top panel) and CD8+ (bottom panel) T cells, as measured by flow cytometry (B, n=5), or cytokine production by CD3+ T cells, as measured by Luminex (C, n=4), after co-incubation of CD3+ cells with either no APC or one of three SF APC types for 5 days, in the presence of anti-CD3. (D) Expression of co-stimulatory markers CD80, CD86, MHC II molecule HLA-DR, and activation marker CD40 by APC in paired PB and SF, as measured by flow cytometry (n=5). One-way ANOVA, *p < 0.05, **p < 0.01.

