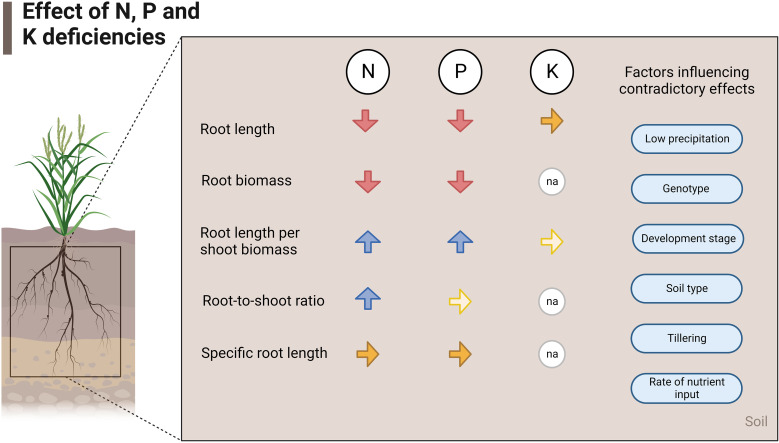
Figure 5.
Effects of N, P, and K deficiencies at field scale. The red arrows show a decrease, the blue arrows show an increase and the yellow arrows show similarity in that trait in case of deficiency of the respective nutrient. Lighter-colored arrows stand for few studies found investigating that specific parameter (2-4 studies), and na stands for not applicable.

