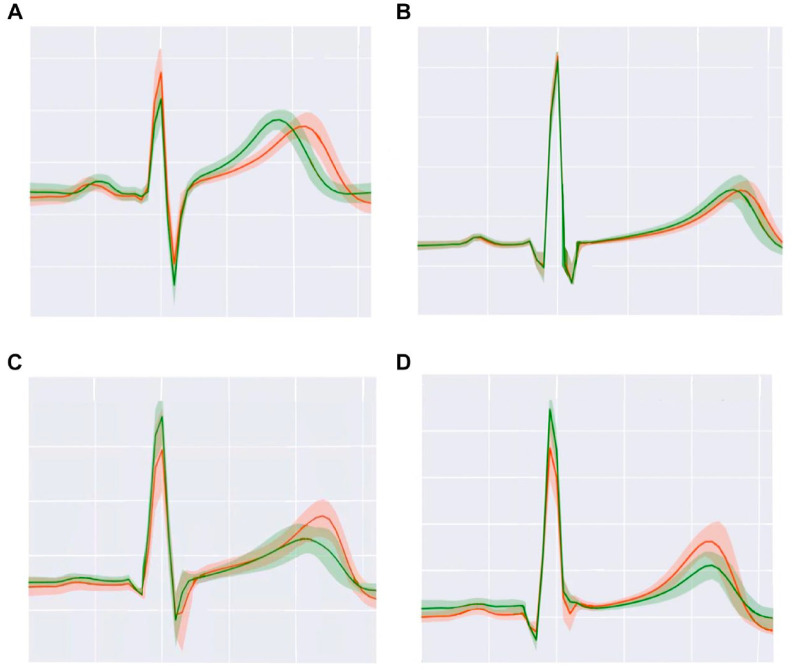
Figure 2.
Illustration of interindividual differences in EKGs during hypoglycemia (orange lines) compared to normoglycemia (green lines) in 4 subjects with T1D. (A) Subject 1. (B) Subject 2. (C) Subject 3. (D) Subject 4. During hypoglycemia, subjects 1 and 2 have a longer QT interval and subjects 3 and 4 have a higher T wave. Adapted from source: © 2021 Diouri et al 28 Diabetes/Metabolism Research and Reviews published by John Wiley & Sons Ltd. under a CCBY-NC-ND license.

