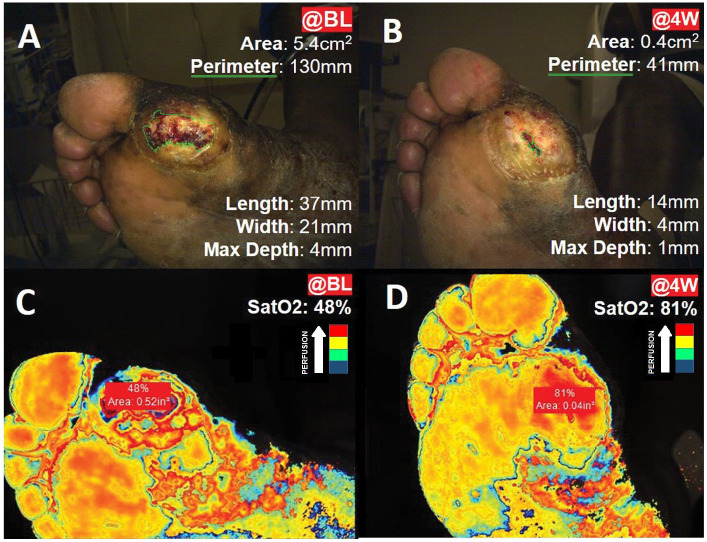
Figure 3.
Wound measurements and tissue oxygen saturation (SatO2) in a typical case from the intervention group. Panels A and B represent the wound measurements by 3D Silhouette camera (green outline) at: (A) baseline (@BL); and (B) at 4 weeks (@4W). Panels C and D represent tissue oxygen saturation (SatO2) assessed with near-infrared spectroscopy, where blue color represents the lowest perfusion, and red color represents the highest perfusion: (C) wound SatO2 @BL; (D) wound SatO2 @4W.

