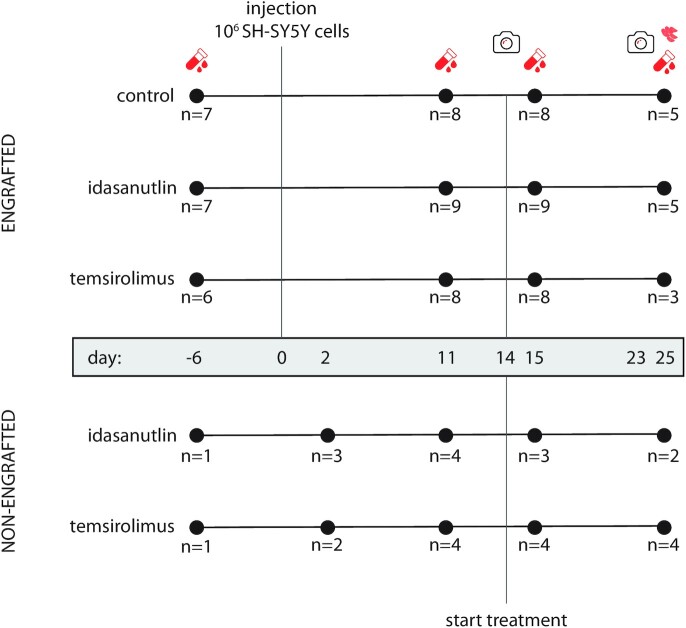
Figure 1.
Schematic representation of the study. Numbers represent the amount of mice at each time point for each condition after deduction of samples with high degree of hemolysis and samples with <0.5 million mapped miRNAs. Red collection tubes represent blood collections, red tumour cells represent the collection of tumour material, cameras represent luciferase imaging.

