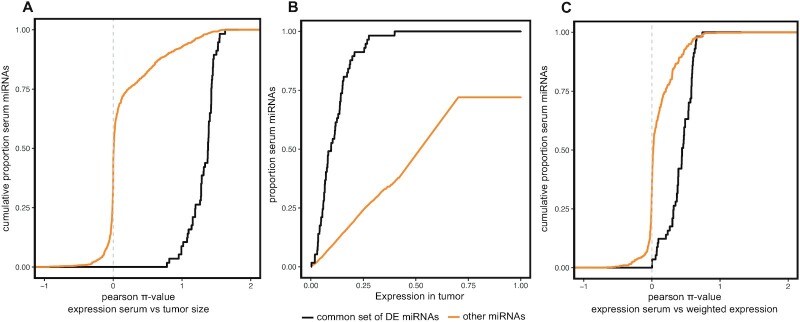
Figure 3.
Serum miRNA expression correlates with tumour size. (A) Cumulative fraction of serum miRNAs by Pearson π-value (= Pearson's ρ × (–log10(P-value)); P-value corrected for multiple testing using Benjamin–Hochberg) of the correlation between miRNA serum expression and tumour size (measured by luciferase imaging, 14 days and 23 days after tumour cell injection). The 57 differentially expressed miRNAs (black) correlate significantly better with tumour size than other serum miRNAs (orange) (P < 2.2 × 10⁻¹⁶, Kolmogorov–Smirnov test). (B) Cumulative fraction of serum miRNAs ranked by expression in the tumour. The 57 differentially expressed serum miRNAs (black) are much higher expressed in the tumour than other serum miRNAs (orange) (P < 2.2 × 10⁻¹⁶, Kolmogorov–Smirnov test). All 57 serum miRNAs are among the top expressed tumour miRNAs, with half of these serum miRNAs among the top 10% expressed tumour miRNAs. (C) Cumulative fraction of serum miRNAs by Pearson π-value of the correlation between miRNA serum expression and weighted tumour expression (tumour size × tumour expression). The 57 differentially expressed miRNAs (black) correlate significantly better with weighted tumour expression than other serum miRNAs (orange) (P < 2.2 × 10⁻¹⁶, Kolmogorov–Smirnov test).

