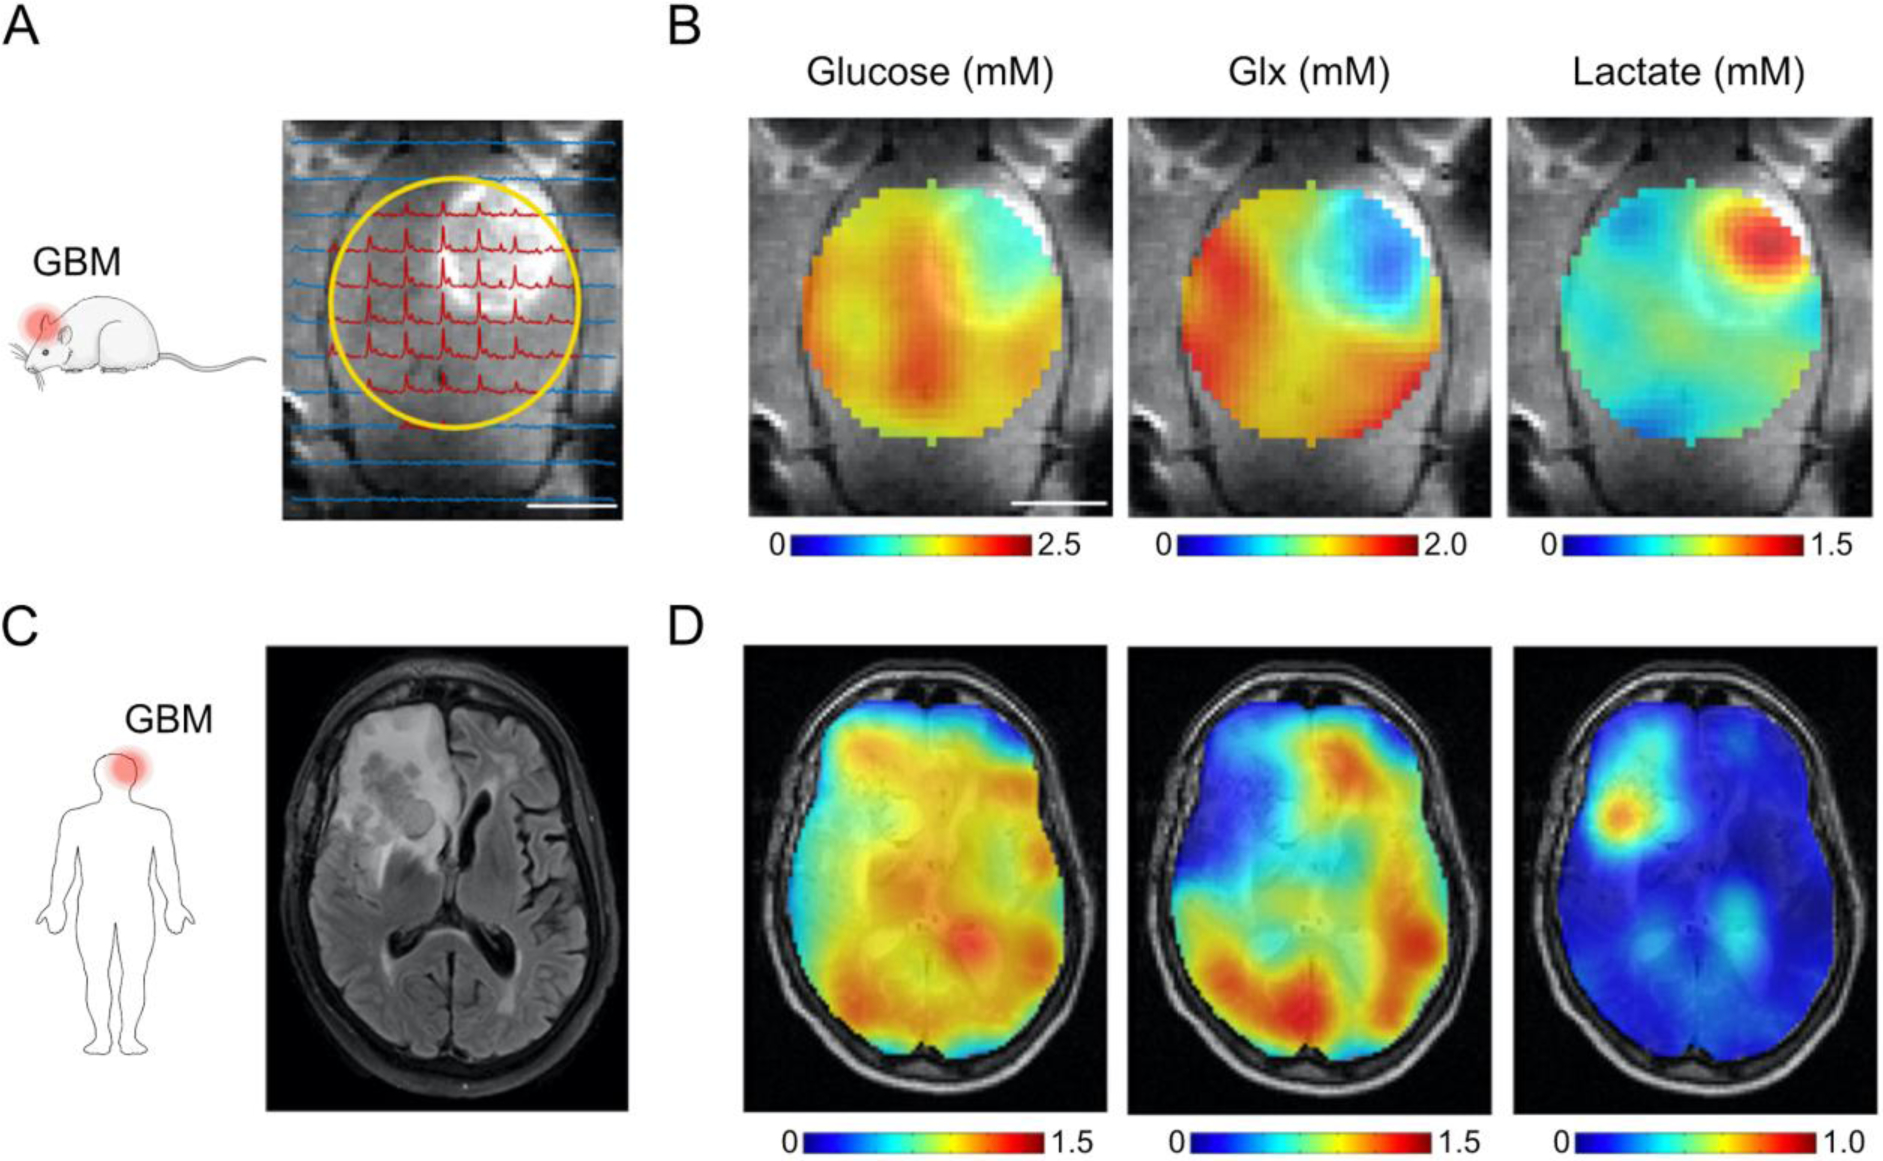
Figure 2.

DMI depicts the Warburg effect in experimental and clinical glioblastoma multiforme (GBM). A) Contrast-enhanced T1-weighted MRI shows hyperintense signal from tumor tissue in a rat glioma model. Surface radiofrequency coil position for DMI (yellow circle) and localized 2H MR spectra are overlaid onto the MR image. B) Maps of glucose uptake and downstream metabolites, i.e. glutamate and glutamine (Glx) and lactate, reveal active Warburg effect in and around the brain tumor after intravenous infusion of 1.95 g [6,6′]-2H2-glucose per kg body weight. C) Standard-of-care T2-weighted fluid-attenuated inversion recovery MR image from a patient diagnosed with GBM in the right frontal lobe. D) Glucose and metabolite maps overlaid onto T2-weighted MRI show lower levels of 2H-labeled Glx and higher concentration of 2H-labeled lactate in and around the tumor lesion compared to normal-appearing brain tissue, similar to the metabolite maps from the rat glioma model in (B). Subjects orally ingested 0.60–0.75 g [6,6′]-2H2-glucose per kg body weight, with a maximum of 60 g. Color-coded glucose, Glx and lactate maps are expressed in millimolar concentrations. Abbreviations: Glc = glucose, Glx = glutamate & glutamine, Lac = lactate. Figure adapted from De Feyter et al. (2018) with authors’ permission.
