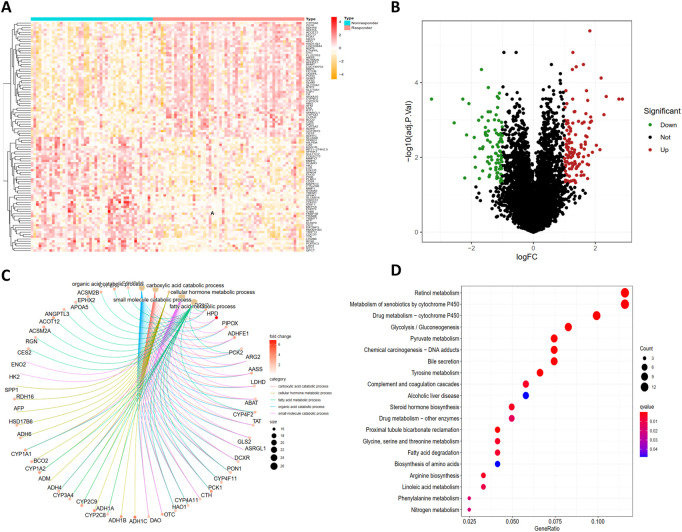
FIGURE 2.
Identification of DEGs and functional enrichment analysis of DEGs. The heatmap (A) and volcano plot (B) of differentially expressed genes (DEGs) between TACE-Nonresponse and TACE-Response samples, Gene Ontology (GO) (C) and Kyoto Encyclopedia of Genes and Genomes (KEGG) (D) functional enrichment analysis of DEGs.

