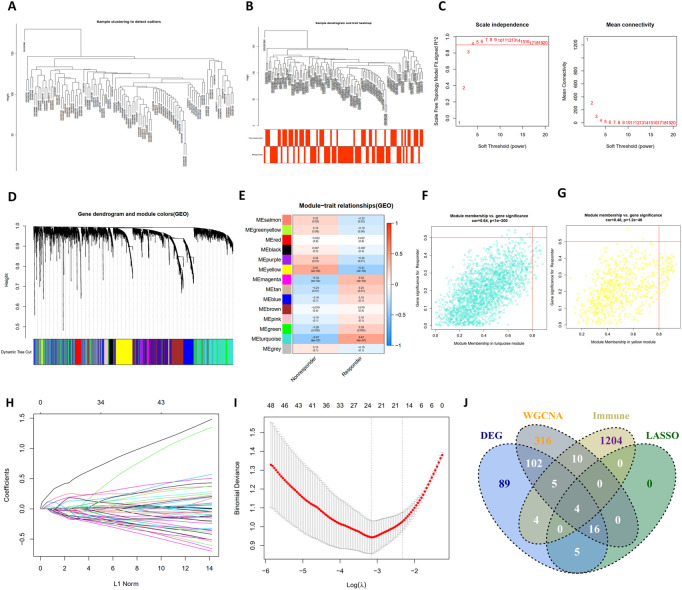
FIGURE 3.
The construction of WGCNA network, LASSO regression analysis and venngram of final hub genes. (A) Clustering dendrogram of samples in the dataset GSE104580. (B) Clustering dendrogram of 66 TACE-Nonresponders and 81 TACE-Responders samples. (C) Analysis of network topology for various soft-thresholding powers. (D) Clustering dendrogram of mRNAs, with dissimilarity based on topological overlap, together with assigned module colors. (E) The heatmap to show the correlation between module eigengenes and patient response (TACE-Nonresponse and TACE-Response). (F,G) The scatter plots of module eigengenes in turquoise module and yellow module. (H) The LASSO coefficient profiles of genes, (I) The feature selection by LASSO analysis. The X-axis shows Log (λ), and the Y-axis shows the binomial deviance, (J) The venngram of final hub genes.

