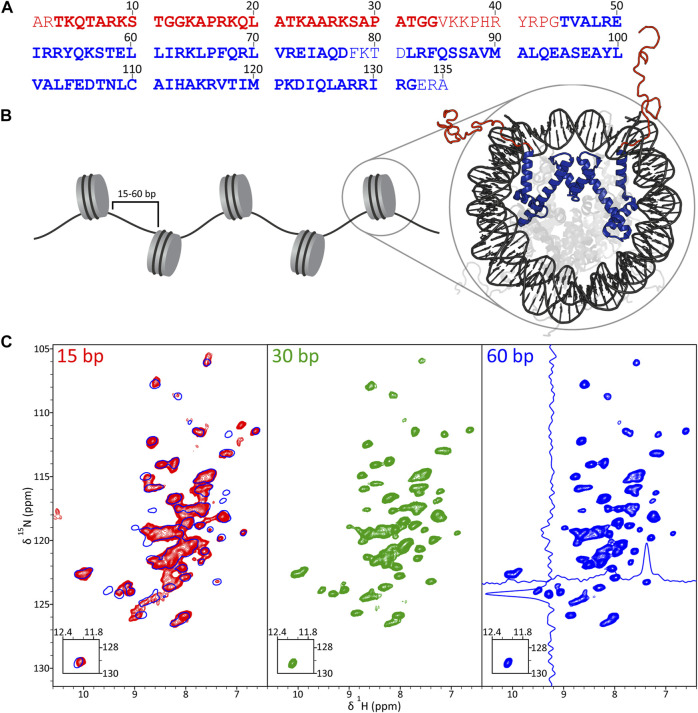
FIGURE 1.
(A) Primary sequence of Xenopus laevis histone H3, with disordered tail and structured core domain residues indicated in red and blue font, respectively, based on the nucleosome crystal structure (PDB 1KX5). Also highlighted are residues detectable in solid-state NMR experiments employing J-coupling (bold red) and dipolar coupling (bold blue) based polarization transfers. (B) Schematic representation of a nucleosome array with H3 tail and core domains colored in red and blue, respectively, in the nucleosome crystal structure. (C) 1H-15N CP-HSQC fingerprint spectra of 2H,13C,15N-H3 in 16-mer nucleosome arrays with 15 bp (red contours), 30 bp (green contours) and 60 bp (blue contours) DNA linkers. The spectrum for arrays with 60 bp DNA linkers shows representative traces along the 1H and 15N dimensions, and the spectrum for arrays with 15 bp DNA linkers contains an overlay with that for the 60 bp DNA linker sample (single blue contour). All spectra were recorded at 800 MHz 1H frequency and 60 kHz MAS rate.

