FIGURE 2.
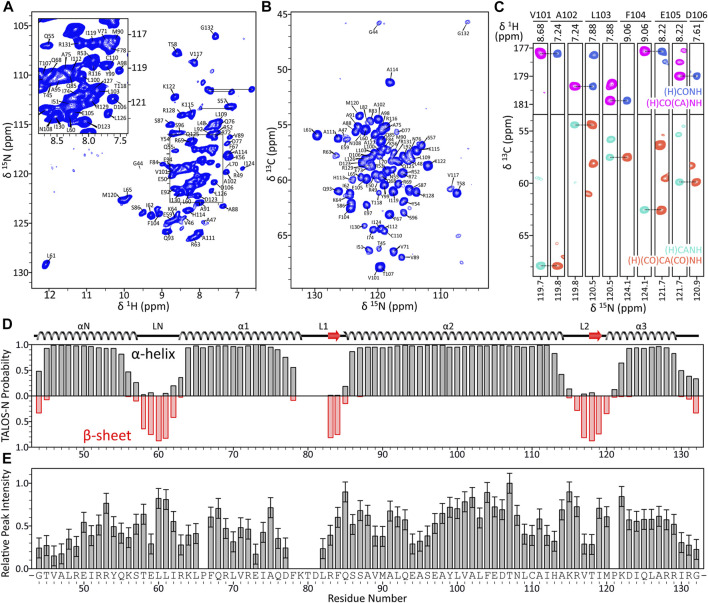
(A) Assigned 15N-1H CP-HSQC spectrum of H3 core domain in 16-mer nucleosome arrays with 60 bp linker DNA length. (B) Assigned 15N-13Cα projection from the 3D (H)CANH spectrum and (C) representative small regions from 3D (H)CANH, (H)(CO)CA(CO)NH, (H)CONH and (H)CO(CA)NH spectra of the same sample, illustrating a sequential backbone walk for residues V101-D106. All spectra were recorded at 800 MHz 1H frequency and 60 kHz MAS rate. The 2D 15N-1H spectrum was recorded with acquisition times of 25 ms (t1, 15N) and 15 ms (t2, 1H) and a total measurement time of ∼14 h. The 3D 13C-15N-1H spectra were recorded with acquisition times of ∼10 ms (t1, 13C), ∼12 ms (t2, 15N), and 30 ms (t3, 1H) and total measurement times of ∼2–9.5 days. (D) TALOS-N secondary structure prediction for the H3 core domain in nucleosome arrays with 60 bp DNA linkers based on the assigned 1H, 15N and 13C chemical shifts with comparison to the secondary structure of H3 in the nucleosome crystal structure (PDB 1KX5), and (E) relative peak intensities in the 3D (H)CANH spectrum plotted as a function of residue number.

