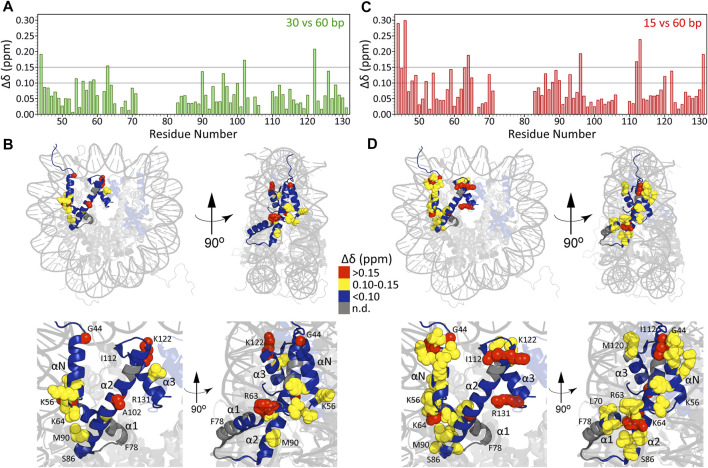
FIGURE 3.
Chemical shift differences (Δδ) for H3 core residues in nucleosome arrays with 30 bp DNA linkers relative to those with 60 bp linkers plotted as a function of residue number (A) and mapped on the nucleosome crystal structure (B) as described in the inset legend. (C, D) Same as (A, B) but for arrays with 15 bp DNA linkers. For both comparisons, the 0.10 and 0.15 ppm thresholds indicated correspond to approximately 2.5 and 5 standard deviations above the average Δδ calculated using subsets of residues with individual Δδ values of less than 0.1 ppm.

